1. China's copper foil import and export situation
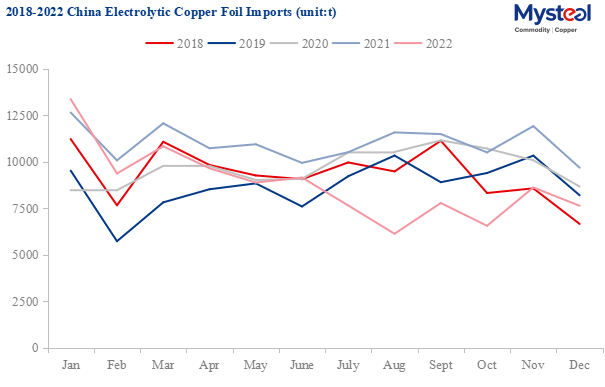
1.1. China's copper foil imports decrease by 11.40% MoM
China's copper foil import decreased by 982 tonnes or 11.40% month on month and 2,048 tonnes or 21.16% year on year to 7,633 tonnes in December. China's cumulative import of copper foil in 2022 also decreased by 26,477 tonnes or 20.05% year on year to 105,589 tonnes.
Data Source: GACC, Mysteel
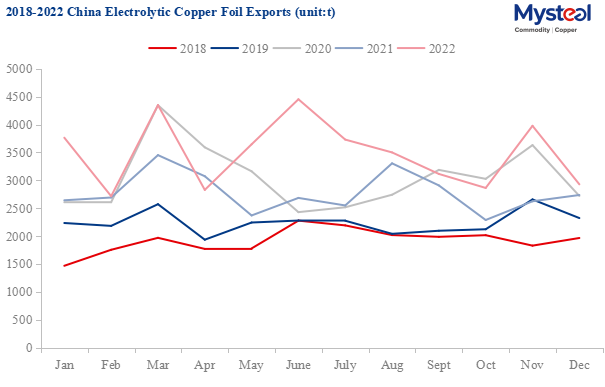
1.2. China's copper foil exports decrease by 26.36% MoM
China's copper foil export decreased by 1,049 tonnes or 26.36% month on month and increased by 192 tonnes or 7.02% year on year to 2,939 tonnes in December. The cumulative export of copper foil in China was 41,870 tonnes in 2022, which increased by 8,545 tonnes or 25.64% year on year.
Data Source: GACC, Mysteel
1.3. Trade deficit of copper foils imp & exp increases by 1.43% MoM
The trade deficit of copper foils imports and exports increased by 67 tonnes or 1.43% month on month to 4,704 tonnes. The total trade deficit declined by 35,022 tonnes or 35.47% year on year to 63,719 tonnes in 2022.
Data Source: GACC, Mysteel
2. Top five regions for import and export situation
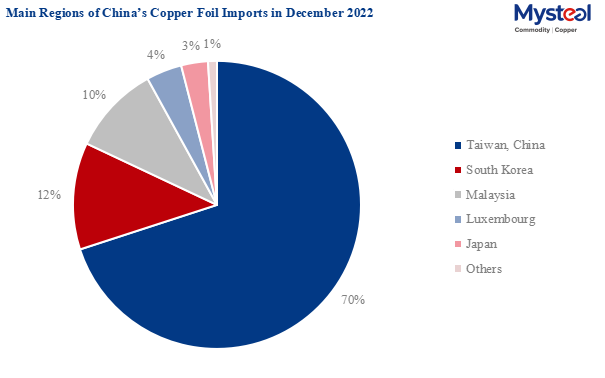
2.1. Top five regions for imports
China mainland imported copper foils mainly from east Asia, and the top five regions whose total exports to China mainland in December were 7,537 tonnes and accounted for 98.74% of China mainland's total import volume, were Taiwan China, South Korea, Malaysia, Luxembourg, and Japan. Wherein, Taiwan China, South Korea, and Malaysia are the top three regions, and exported 7,051 tonnes to China mainland in December, accounting for 92.37% of total imports. The total imports from these three regions and the top five regions in 2022 were 95,728 tonnes and 103,596 tonnes, which accounted for 90.66% and 98.11% of the total import volume.
Data Source: GACC, Mysteel
| Main Regions of China's Copper Foil Imports in Dec 2022 | ||||||
| Country/ Region |
Dec Import (t) | Average Price (Yuan/t) | MoM | YoY | 2022 Import (t) | YoY |
| Taiwan, China | 5,366 | 85,979 | -9.34% | -7.01% | 67,445 | -24.27% |
| South Korea | 918 | 112,993 | -19.32% | -58.02% | 19,135 | -6.31% |
| Malaysia | 766 | 112,377 | -19.04% | 8.85% | 9,148 | 1.49% |
| Luxembourg | 292 | 96,828 | 8.42% | -29.65% | 4,500 | -11.22% |
| Japan | 194 | 149,304 | -24.33% | -53.09% | 3,368 | -24.46% |
| Total | 7,633 | 96,110 | -11.40% | -21.16% | 105,589 | -20.05% |
| Data Source: GACC, Mysteel | ||||||
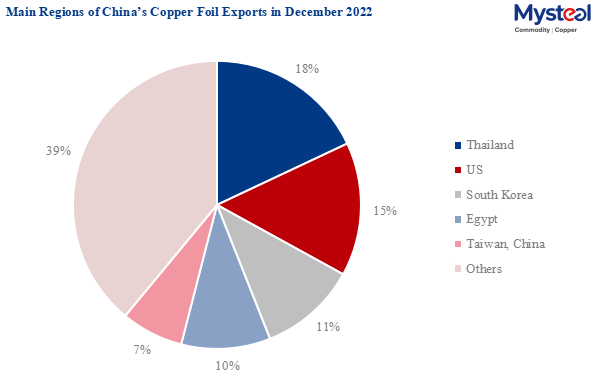
2.2. Top five regions for exports
China mainland exported 1,788 tonnes of copper foil in December to Thailand, the United States, South Korea, Egypt, and Taiwan China, which were the top five regions and accounted for 61.06% of its total export volume. And the cumulated export volume of the top five regions was 24,000 tonnes in 2022, accounting for 57.32% of the total export volume.
Data Source: GACC, Mysteel
| Main Regions of China's Copper Foil Exports in Dec 2022 | ||||||
| Country/ Region |
Dec Export (t) | Average Price (Yuan/t) | MoM | YoY | 2022 Export (t) | YoY |
| Thailand | 531 | 77,719 | -10.19% | 379.61% | 5,610 | 197.84% |
| US | 443 | 93,291 | -13.78% | 609.96% | 3,152 | 756.00% |
| South Korea | 321 | 91,973 | -20.68% | 14.55% | 4,999 | -21.77% |
| Egypt | 303 | 66,861 | -13.44% | -40.80% | 8,143 | 203.61% |
| Taiwan, China | 191 | 70,082 | -54.84% | 146.30% | 2,096 | 26.70% |
| Total | 2,929 | 79,722 | -26.36% | 7.02% | 41,870 | 25.64% |
| Data Source: GACC, Mysteel | ||||||
3. Prices of electronic copper foil import and export
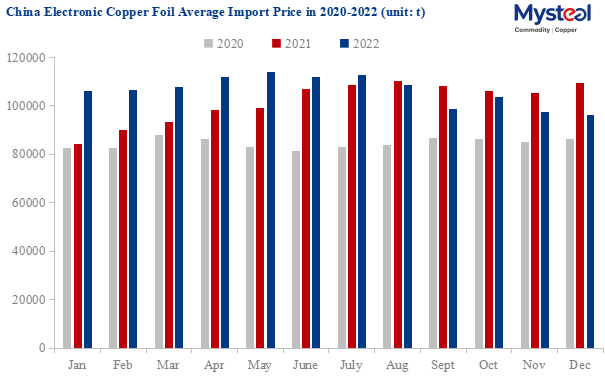
3.1. Electronic copper foil import price
Currently, China mainland mainly imports high-end electronic copper foil with large volumes and high unit prices. The average import price was Yuan 96,110/tonne with a total amount of Yuan 733.59 million in December, wherein, the highest average price was from the United State with Yuan 763,869/tonne and the highest total amount of imports was from Taiwan China with about Yuan 461.40 million.
Data Source: GACC, Mysteel
| China Copper Foil Import Price in Dec 2022 | |||
| Country/region | Amount (t) | Value (Yuan) | Average Price (Yuan/t) |
| Taiwan, China | 5,366 | 461,400,000 | 85,979 |
| Japan | 194 | 29,040,000 | 149,304 |
| Malaysia | 766 | 86,130,000 | 112,377 |
| South Korea | 918 | 103,700,000 | 112,993 |
| US | 13 | 10,110,000 | 763,869 |
| Luxembourg | 292 | 28,270,000 | 96,828 |
| Germany | 31 | 5,640,000 | 181,186 |
| Philippines | 50 | 8,810,000 | 175,834 |
| Total | 7,633 | 733,590,000 | 96,110 |
| Data Source: GACC, Mysteel | |||
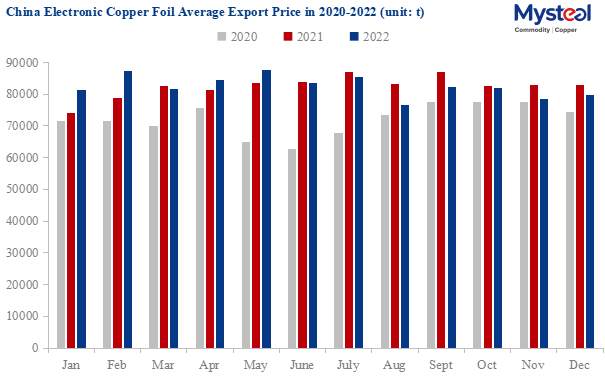
3.2. Electronic copper foil export price
China mainland's average price spread between the import and export of electronic copper foil was Yuan 16,388/tonne in December, which was mainly based on mid- and low-end copper foil at present with an average export price of Yuan 79,722/tonne and a total amount of Yuan 233.49 million.
Data Source: GACC, Mysteel
| China Copper Foil Export Price in Dec 2022 | |||
| Country/region | Amount (t) | Value (Yuan) | Average Price (Yuan/t) |
| Vietnam | 115 | 9,025,243 | 78,684 |
| South Korea | 321 | 29,489,679 | 91,973 |
| Taiwan, China | 191 | 13,365,244 | 70,082 |
| Japan | 22 | 2,100,174 | 96,702 |
| Malaysia | 151 | 12,335,414 | 81,948 |
| India | 37 | 4,300,091 | 116,335 |
| Indonesia | 107 | 6,798,339 | 63,255 |
| US | 443 | 41,324,339 | 93,291 |
| Hong Kong, China | 29 | 4,019,347 | 139,701 |
| Russia | 10 | 1,179,326 | 114,498 |
| Thailand | 531 | 41,251,490 | 77,719 |
| Philippines | 9 | 589,674 | 65,418 |
| Turkey | 88 | 5,884,718 | 67,175 |
| Singapore | 13 | 3,167,606 | 235,878 |
| Saudi Arabia | 148 | 9,506,100 | 64,097 |
| UK | 10 | 792,542 | 75,929 |
| South Africa | 25 | 1,459,853 | 57,633 |
| Egypt | 303 | 20,268,377 | 66,861 |
| Mexico | 17 | 1,121,949 | 64,317 |
| Bengal | 5 | 371,601 | 78,963 |
| Pakistan | 52 | 3,223,378 | 62,430 |
| Brazil | 2 | 286,589 | 187,681 |
| Germany | 11 | 786,919 | 70,779 |
| Italy | 3 | 418,247 | 151,101 |
| Sweden | 45 | 3,368,910 | 75,580 |
| Romania | 23 | 1,598,906 | 68,599 |
| Hungary | 34 | 2,212,373 | 65,434 |
| Qatar | 33 | 2,138,443 | 64,801 |
| France | 3 | 245,503 | 87,212 |
| Australia | 14 | 939,398 | 66,206 |
| Jordan | 40 | 2,704,907 | 68,125 |
| Portugal | 6 | 420,974 | 66,316 |
| Spain | 5 | 304,809 | 66,422 |
| Argentina | 7 | 551,623 | 74,383 |
| Macao, China | 14 | 1,135,513 | 78,806 |
| Kazakhstan | 3 | 249,380 | 92,534 |
| Columbia | 6 | 385,370 | 65,584 |
| Slovakia | 34 | 2,527,340 | 73,864 |
| Chile | 14 | 1,004,325 | 73,459 |
| Netherlands | 1 | 142,713 | 112,817 |
| Lebanon | 4 | 235,205 | 60,263 |
| Total | 2,929 | 233,485,894 | 79,722 |
| Data Source: GACC, Mysteel | |||
Written by Edenlis Huang, huangting@mysteel.com
Edited by Paula Xu, xuzhongping@mysteel.com