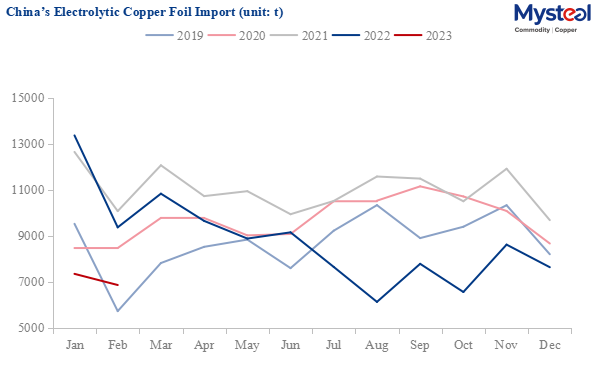
China's refined copper foil (without backing, thickness ≤ 0.15 mm) imports decreased by 37.52% year on year to 14,202 tonnes in January-February 2023, according to the General Administration of China Customs (GACC). Wherein, imports in January decreased by 45.05% year on year to 7,344 tonnes, and in February decreased by 26.78% year on year to 6,858 tonnes.
Data Source: GACC, Mysteel
Taiwan province is still the largest source region of China mainland's copper foil imports, accounting for 74.70%, mainly because Taiwan, China is the world's major production area of copper foil for electronic circuits with more price advantages in terms of product quality and capacity, while China mainland's current copper foil imports are still dominated by copper foils for electronic circuits. Meanwhile, South Korea and Malaysia are also major import sources.
| Sources for China's Backless Refined Copper Foil Imports | |||||
| Countries/Regions | Import in Jan-Feb 2023 (t) |
Proportion | Average Import Price (Yuan/t) |
Import in Jan-Feb 2022 (t) |
YoY |
| Taiwan, China | 10,608 | 74.70% | 87,075 | 14,765 | -28.15% |
| Japan | 403 | 2.84% | 129,288 | 587 | -31.27% |
| Malaysia | 1,060 | 7.46% | 115,447 | 1,262 | -16.03% |
| South Korea | 1,473 | 10.37% | 107,102 | 4,894 | -69.90% |
| Germany | 67 | 0.47% | 152,605 | 72 | -7.23% |
| US | 7 | 0.05% | 967,778 | 19 | -65.24% |
| the Philippines | 160 | 1.13% | 174,120 | 249 | -35.65% |
| Luxembourg | 417 | 2.94% | 84,682 | 840 | -50.36% |
| Total | 14,202 | 100.00% | 94,125 | 22,730 | -37.52% |
| Data Source: GACC, Mysteel | |||||
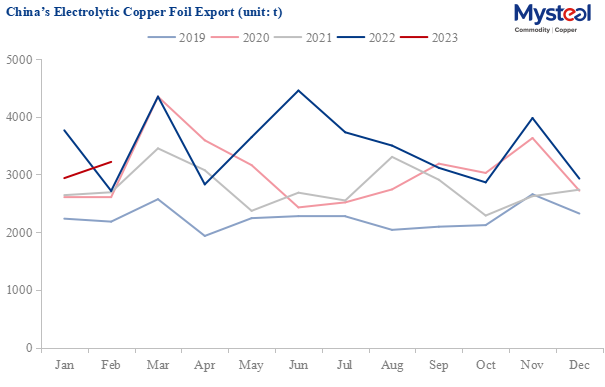
China's refined copper foil (without backing, thickness ≤ 0.15 mm) exports decreased slightly by 5.01% to 6,154 tonnes in January-February 2023 due to the Spring Festival holiday in January, according to the General Administration of China Customs (GACC). Among them, 2,936 tonnes were exported in January, with a year-on-year decrease of 21.98%, and 3,217 tonnes were exported in February, with a year-on-year decrease of 18.50%.
Data Source: GACC, Mysteel
There were a total of 17 destination countries and regions where China exported over 50 tonnes of copper foil in January-February, with Egypt, Thailand, and South Korea being the three top countries, accounting for 25.31%, 20.47%, and 13.42% of the total export volume respectively. Egypt's share continued to rise. The unit price of copper foil exported to Japan, Taiwan, China, South Korea, and the US was much higher than that exported to Southeast Asia and Africa, which also reflects the difference in export destinations of different types of copper foil.
| Destinations for China's Backless Refined Copper Foil Exports | |||||
| Countries/Regions | Export in Jan-Feb 2023 (t) |
Proportion | Average Export Price (Yuan/t) |
Export in Jan-Feb 2022 (t) |
YoY |
| South Korea | 826 | 13.42% | 94,574 | 810 | 2.04% |
| Vietnam | 192 | 3.12% | 85,203 | 288 | -33.34% |
| Malaysia | 537 | 8.72% | 86,256 | 338 | 58.57% |
| Japan | 69 | 1.13% | 102,784 | 81 | -14.84% |
| US | 115 | 1.87% | 94,084 | 494 | -76.67% |
| Taiwan, China | 73 | 1.19% | 112,086 | 314 | -76.77% |
| Hongkong, China | 58 | 0.95% | 109,095 | 698 | -91.65% |
| Indonesia | 207 | 3.36% | 62,955 | 256 | -19.38% |
| Thailand | 1,260 | 20.47% | 79,589 | 289 | 336.06% |
| Saudi Arabia | 343 | 5.57% | 66,355 | 686 | -50.01% |
| Egypt | 1,558 | 25.31% | 65,787 | 1,255 | 24.11% |
| Pakistan | 108 | 1.75% | 63,620 | 141 | -23.62% |
| South Africa | 101 | 1.64% | 56,984 | 0 | 100.00% |
| Turkey | 64 | 1.04% | 67,540 | 17 | 282.01% |
| Slovakia | 52 | 0.84% | 73,851 | 10 | 395.19% |
| Sweden | 89 | 1.44% | 73,391 | 17 | 422.85% |
| Algeria | 101 | 1.65% | 67,436 | 4 | 2303.49% |
| Total | 6,154 | 100% | 77,337 | 6,479 | -5.01% |
| Data Source: GACC, Mysteel | |||||
However, Southeast Asia and Africa are increasingly becoming the main destinations for China's copper foil exports, as the proportion of China's exports to Southeast Asia and Africa continues to increase year on year.
| Destination Areas for China's Backless Refined Copper Foil Exports | |||||
| Areas | Export in Jan-Feb 2023 (t) |
Proportion | Average Export Price (Yuan/t) |
Export in Jan-Feb 2022 (t) |
YoY |
| Africa | 1,760 | 28.59% | 65,390 | 1,259 | 39.76% |
| Europe | 267 | 4.34% | 75,735 | 479 | -44.31% |
| East Asia | 1,054 | 17.12% | 96,787 | 1,903 | -44.63% |
| Southeast Asia | 2,203 | 35.80% | 80,171 | 1,200 | 83.55% |
| South Asia | 160 | 2.60% | 68,507 | 190 | -15.83% |
| West Asia | 487 | 7.92% | 66,462 | 753 | -35.30% |
| North America | 116 | 1.89% | 93,894 | 499 | -76.70% |
| Latin America | 72 | 1.18% | 74,447 | 158 | -54.17% |
| Total | 6,154 | 100% | 77,337 | 6,479 | -5.01% |
| Data Source: GACC, Mysteel | |||||
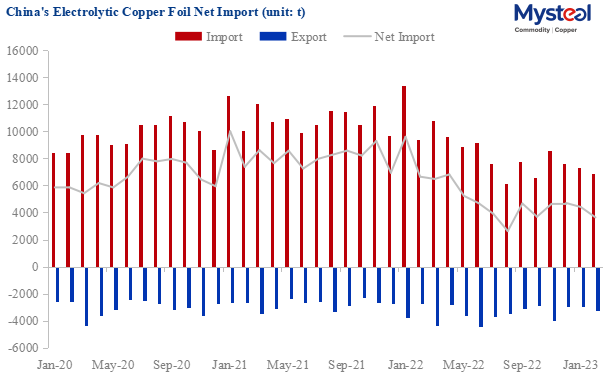
Overall, China's copper foil production capacity continued to release from January to February, and the growth trend will continue. Due to the impact of the Spring Festival holiday, the operating rate of Chinese copper foil processing enterprises decreased in January, resulting in a slight decline in exports. However, with the recovery of consumption, the current output of Chinese copper foil processing enterprises continues to increase, reflecting a more significant decrease in imports than exports. In addition, as more and more Chinese processing enterprises shift their production capacity to producing high-end electronic circuit copper foils such as high-frequency and high-speed, it is expected to reduce China's copper foil imports and boost exports.
Data Source: GACC, Mysteel
Written by Edenlis Huang, huangting@mysteel.com
Edited by Paula Xu, xuzhongping@mysteel.com