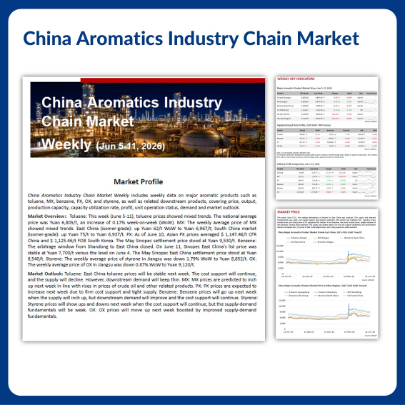
• Home
  • /
  • Products & Services
  • /
  • Reports & Analysis

China PP Data Report

Including – Weekly EXCEL covering

  • PP International and Domestic Price
  • China PP Supply (100% coverage)
    • Product Coverage: Oil-based & Coal-based & PDH-based PP
    • Production Output & Operating Rate
  • China PP Demand
    • (BOPP, PP Woven Fabric, CPP Film, BOPP Adhesive Jumbo Roll)
  • PP Inventory, including:
    • Inventory of Sinopec and PetroChina (by sales branch, 100% coverage)
    • Inventory of Raffia Manufacturers (100% coverage)
    • Port Inventory (major 27 ports in 6 cities)
  • China PP Cost and Profit of Oil/Coal/ PDH-based Units
  • PP Powder supply
    • Output and Operation Rate (100% coverage)
    • Inventory (95% coverage)
  • China PP Plant Maintenance & Unit Commissioning Schedule
PP Data Package Weekly

China PE Data Report

Including – Weekly EXCEL covering

  • Market Price (HDPE, LDPE and LLDPE)
  • Supply (Data coverage 100%), including:
    • Output by oil-based and coal-based producers
    • Production loss from maintenance
    • Operating rate by oil-based and coal-based producers
  • Demand:
    • Operating rate of Downstream industries
  • Inventory, including that:
    • By oil majors (100% coverage) and coal-based producers (88% coverage)
  • Production Cost & Profit
  • China PE Unit Maintenance and Commissioning Schedule
  • China Import & Export
PE Data Package Weekly

China Chemical Industry Monthly Report

Comprehensive Overview of China’s Chemical Market - Monthly


Delivering data-driven, actionable insights tailored for an overall integrated view on cross-chemical products:

  • Full-spectrum industry chain coverage – Monthly updates on prices, production profits, inventory, and capacity utilization provide a holistic view of market conditions across olefins, aromatics, alkanes, phenol and acetone, plasticizers, synthetic fibers, plastics, rubber, methanol, acrylic acid, and esters.
  • Visual insight charts – Monthly price changes across major chemical products are visualized on a flowchart, comparing deviations (%) from the past one-year lowest level and five-year historical positioning (%) in prices, production profit shifts, and utilization rates.
  • Chemical industry performance indices- Exclusive chemical industry composite capacity utilization rate, profit index, and inventory index to monitor overall chemical production performance and downstream market demand dynamics.
  • Raw material analysis – MoM analysis of refined oil crack spreads, crude oil market dynamics, and CDU operating rates to assess cost-side pressures and macroeconomic impacts on chemical markets.
  • Macroeconomic and policy environment monitoring – China's domestic and international macroeconomic trends, including U.S. trade policies and China's policy signals from important meetings.
  • Downstream end-user market demand evaluation – Updates on performance and trends across key downstream sectors, including real estate, automotive, and household appliances, along with the road freight volume index, which reflects demand shifts.
  • Monthly market outlooks – Short-term trend outlook by industry chain, identifying expected price movements, inventory level, supply-demand trends, cost factors, and seasonal patterns.
  • Appendix Construction Progress of Key Chemical Projects and Top 100 Products in Imports & Exports


Publishing day: Every month on 10th, except for Chinese public holidays.

Comprehensive Overview of China’s Chemical Market - Monthly Delivering data-driven, actionable insights tailored for an overall integrated view on cross-chemical products: •	Full-spectrum industry chain coverage – Monthly updates on prices, production pro

China PU Industry Weekly Indicators

PU Industry Data Indicators at one glance


Bird-eye view of Chinese PU value chain, from feedstock to downstream, market price trend and fundamental drivers consolidated in an integrated easy to view chart.


What’s Included:


• 57 data indicators in one chart

• Group by process and end-use applications

• Weekly prices and fundamentals update

• Chinese PU market price fluctuations and demand indicators

• Chinese market prices in USD


Price:

USD 500 / annum

Special promotion: USD 350 / annum (by end of 2024)

Price: USD500.00
PU Weekly Indicators