China's Sept copper foil imports and exports analysis
1. Import and export volume of copper foil
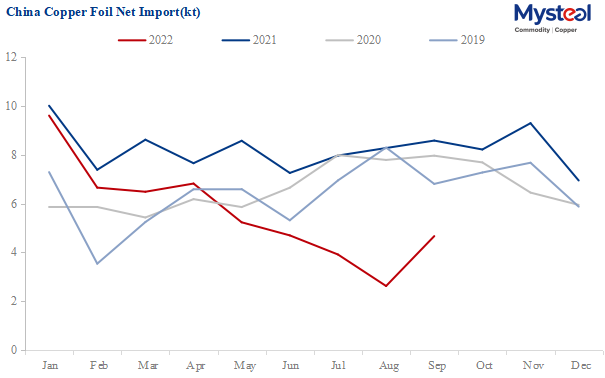
In September 2022, China's import of copper foil was 7,800 tonnes, increased by 1,600 tonnes, or 26.23% month on month, and decreased by 3,700 tonnes, or 32.27% year on year.
From January to September 2022, China's cumulative import of copper foil was 82,700 tonnes, which decreased by 17,100 tonnes or 17.19% year on year.

Data Source: Custom, Mysteel
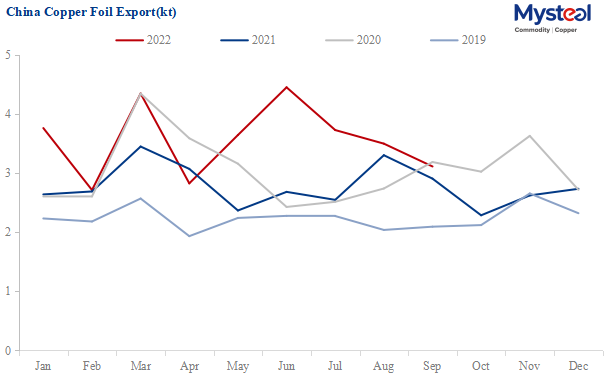
In September 2022, China's export of copper foil was 3,100 tonnes, decreased by 385 tonnes, or 11.02% month on month, and increased by 206 tonnes, or 7.08% year on year.
From January to September 2022, China's cumulative export of copper foil was 32,100 tonnes, which increased by 6,200 tonnes or 27.32% year on year.
Data Source: Custom, Mysteel
In September 2022, the trade deficit in exports of electronic copper foil was 4,700 tonnes, which increased by 2,100 tonnes, or 77.75% month on month.
From January to September 2022, the trade deficit in exports of electronic copper foil totaled 50,700 tonnes, which decreased by 23,600 tonnes or 31.77% year on year.
Data Source: Custom, Mysteel
2. Top 5 regions in import and export volume
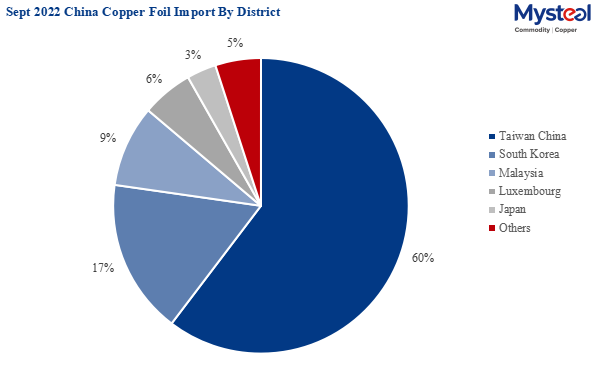
China's copper foil imports are mainly from East Asia, with the top 5 regions being Taiwan province of China, South Korea, Malaysia, Luxembourg, and Japan. In September 2022, the total import volume of copper foil from Taiwan province of China, South Korea, and Malaysia was 7,000 tonnes, accounting for 89.66% of the total import volume. The combined measurement of the top 5 import regions is 7,700 tonnes, accounting for 98.49%.
From January to September 2022, China imported 74,600 tonnes of copper foil from Taiwan province of China, South Korea, and Malaysia, accounting for 90.14% of total imports. China imported 81,100 tonnes of copper foil from the top 5 regions, accounting for 97.92%.
Data Source: Custom, Mysteel
| Sept 2022 China Copper Foil Import by District | ||||||
| Country/District | Sept Import (t) | Average Price (Yuan/t) | MoM | YoY | Accumulative Import (t) | Accumulative YoY |
| Taiwan China | 4,694 | 86,129 | 56.1% | -37.6% | 51,900 | -23.7% |
| South Korea | 1,317 | 118,423 | -5.2% | -24.9% | 16,000 | 10.4% |
| Malaysia | 694 | 130,774 | 13.1% | -1.4% | 6,700 | 0.2% |
| Luxembourg | 436 | 74,060 | -12.6% | 11.6% | 3,700 | -7.3% |
| Japan | 251 | 152,824 | -0.4% | -27.7% | 2,700 | -18.8% |
| Total | 7,780 | 98,697 | 27.0% | -32.3% | 82,800 | -17.2% |
| Data Source: Customs | ||||||
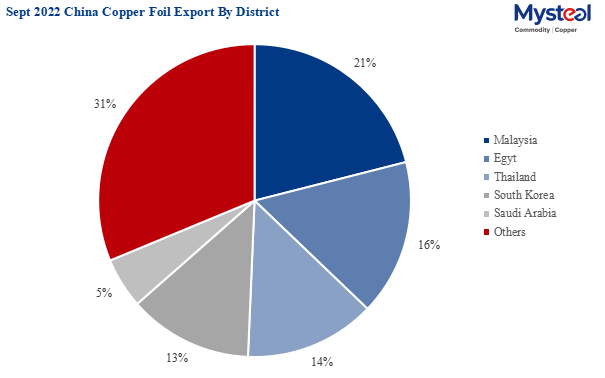
In September 2022, the top 5 regions for China's copper foil exports were Thailand, Malaysia, South Korea, Egypt, and Saudi Arabia, in order. The combined export volume from China to the top 5 export regions was 2,100 tonnes, accounting for 68.76% of the total export volume, which decreased by 14.90% month on month and increased by 29.14% year on year.
From January to September 2022, China exported 21,200 tonnes of copper foil to the top 5 export regions, accounting for 66.15%, with an increase of 73.65% year on year.
Data Source: Custom, Mysteel
| Sept 2022 China Copper Foil Export by District | ||||||
| Country/District | Sept Export (t) | Average Price (Yuan/t) | MoM | YoY | Accumulative Export (t) | Accumulative YoY |
| Thailand | 655 | 74,676 | 76.9% | 178.5% | 4,034 | 175.8% |
| Malaysia | 502 | 79,002 | -13.1% | -13.1% | 3,675 | 22.5% |
| South Korea | 421 | 98,800 | -5.1% | -5.1% | 3,741 | -28.8% |
| Egyt | 400 | 65,949 | -48.5% | 28.9% | 7,322 | 606.3% |
| Saudi Arabia | 163 | 66,873 | -53.1% | 79.8% | 2,464 | 66.7% |
| Total | 3,114 | 82,293 | -11.0% | 7.1% | 32,101 | 25.1% |
| Data Source: Customs | ||||||
3. Import and export price of electronic copper foil
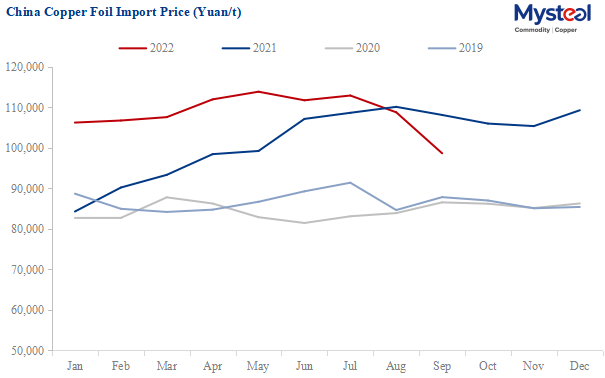
In September, the total amount of electronic copper foil imported by China was Yuan 767.82 million, with an average price of Yuan 98,697/tonne. Among them, the total import valu from Taiwan province of China was the highest with Yuan 42.757 million. Copper foil imported from the Philippines has the highest average price with a total of Yuan 189,914/tonne. China's import of electronic copper foil is still dominated by high-end copper foil presently, with a large import volume and high prices.
Data Source: Custom, Mysteel
| Sept 2022 China Copper Foil Import Price | |||
| Country/District | Volume(t) | Amount of Money (Yuan) | Average Price (Yuan/t) |
| Taiwan China | 4,694 | 427,566,948 | 86,129 |
| Japan | 251 | 38,392,960 | 152,824 |
| South Korea | 1,317 | 155,939,491 | 118,423 |
| Malaysia | 694 | 90,752,131 | 130,774 |
| USA | 9 | 2,063,561 | 236,105 |
| Germany | 40 | 7,000,982 | 176,516 |
| Luxembourg | 436 | 32,263,622 | 74,060 |
| Philippines | 64 | 12,200,995 | 189,914 |
| Total | 7,780 | 767,828,475 | 98,697 |
| Data Source: Customs | |||
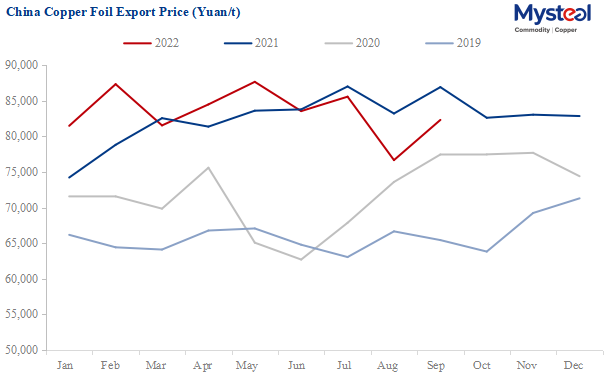
In September, the total amount of electronic copper foil exported by China was Yuan 256.3 million, with an average price of Yuan 82,293/tonne. At present, China's electronic copper foil exports are still dominated by the middle- and low-end. The average price spread between import and export copper foil is Yuan 16,403/tonne.
Data Source: Custom, Mysteel
| Sept 2022 China Copper Foil Export Price | |||
| Country/District | Volume(t) | Amount of Money (Yuan) | Average Price (Yuan/t) |
| South Korea | 421 | 41,624,035 | 98,800 |
| Vietnam | 57 | 5,409,437 | 94,420 |
| Malaysia | 502 | 39,694,698 | 79,002 |
| India | 30 | 3,767,507 | 126,716 |
| Indonesia | 65 | 4,604,788 | 70,449 |
| USA | 21 | 2,534,575 | 121,568 |
| Hongkong China | 10 | 1,483,081 | 154,649 |
| Thailand | 655 | 48,895,357 | 74,676 |
| Taiwan China | 106 | 7,780,949 | 73,590 |
| Egypt | 400 | 26,394,986 | 65,949 |
| Japan | 25 | 2,610,806 | 105,611 |
| Turkey | 34 | 2,629,666 | 77,755 |
| Pakistan | 101 | 6,286,046 | 62,154 |
| Singapore | 21 | 7,512,683 | 365,136 |
| Australia | 23 | 1,509,690 | 67,073 |
| Mexico | 81 | 5,117,283 | 63,406 |
| Saudi Arabia | 163 | 10,876,876 | 66,873 |
| Poland | 180 | 20,743,403 | 115,003 |
| Swedish | 30 | 2,273,538 | 75,679 |
| United Arab Emirates | 24 | 1,551,921 | 64,113 |
| Macau China | 17 | 1,311,099 | 78,693 |
| South Africa | 24 | 1,340,296 | 54,973 |
| Qatar | 22 | 1,363,967 | 61,071 |
| Colombia | 11 | 679,596 | 62,549 |
| Switzerland | 25 | 2,230,900 | 89,172 |
| Kuwait | 20 | 1,316,050 | 64,452 |
| Spain | 13 | 848,640 | 67,406 |
| Total | 3,114 | 256,302,718 | 82,293 |
| Data Source: Customs | |||
For queries and more information/data/reports access, please contact Paula Xu at xuzhongping@mysteel.com
Copper strip prices: Luoyang
Mar 06, 2026 11:56
Copper strip prices: Guangzhou
Mar 06, 2026 11:55
Copper strip prices: Ningbo
Mar 06, 2026 11:54
Copper strip prices: Yantai
Mar 06, 2026 11:54
Copper strip prices: Shijiazhuang
Mar 06, 2026 11:53
