China's Sept copper plate/strip imports and exports analysis
1. Import and export volume of copper plate/strip
In September 2022, the import volume of China's copper plate/strip was 7,300 tonnes, which decreased by 386 tonnes or 5.55% month on month. The main reasons include:
A. The number of import source countries/regions decreased from 24 countries/regions in August to 21 countries/regions in September.
B. Imports from Japan and Finland fell by 518 tonnes and 197 tonnes respectively.
In September 2022, the import volume of copper plate/strip decreased by 2,600 tonnes or 26.6% year on year.
From January to September 2022, the total import volume of copper plate/strip was 76,300 tonnes, which decreased by 20,100 tonnes or 20.86% year on year.
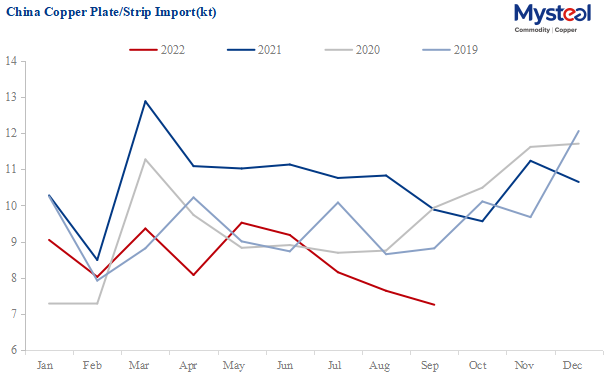
Data Source: Custom, Mysteel
In September 2022, the export volume of China's copper plate/strip was 7,800 tonnes, which decreased by 640 tonnes or 7.59% month on month. The main reasons include:
Exports to China from South Korea, Japan, and Germany fell by 292 tonnes, 141 tonnes, and 133 tonnes respectively.
In September 2022, the export volume of copper plate/strip decreased by 322 tonnes or 3.96% year on year.
From January to September 2022, the cumulative export volume of copper plate/strip was 77,700 tonnes, with an increase of 23,800 tonnes or 44.27% year on year.
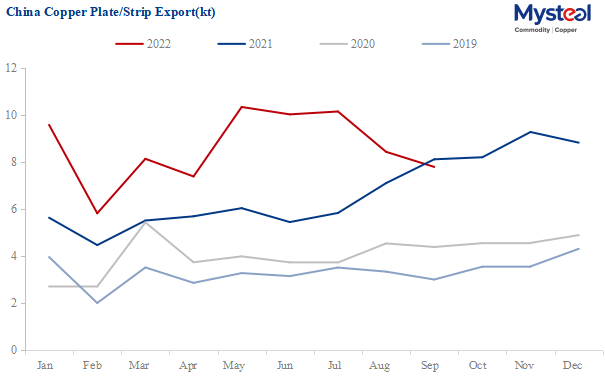
Data Source: Custom, Mysteel
China's copper plate/strip net import volume was -539 tonnes in September, which increased by 32.06% month on month and decreased by 130.45% year on year.
From January to September 2022, the cumulative net import volume of China's copper plate/strip was -1394.391 tonnes, which decreased by 43,900 tonnes or 103.28% year on year.
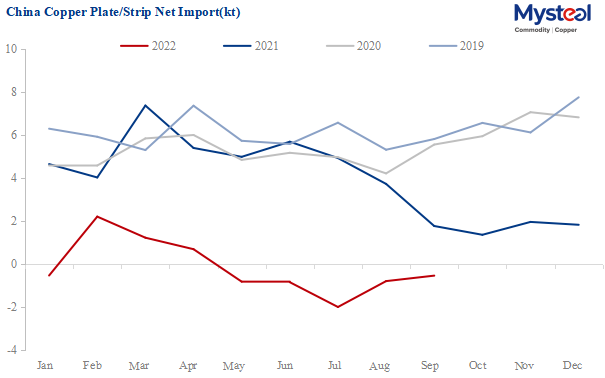
Data Source: Custom, Mysteel
2. Major import and export countries and regions
China's copper plate/strip import areas were relatively concentrated. The top 5 sources of Chinese imports in September were Japan, South Korea, Germany, Taiwan province of China, and the US.
In September 2022, the total import volume of copper plate/strip from Japan, South Korea, and Germany was 6,200 tonnes, accounting for 85.09% of the total import volume. The import volume of the top 5 regions was 6,900 tonnes, accounting for 95.2%.
From January to September 2022, imports from Japan, South Korea, and Germany were 61,000 tonnes, accounting for 80.02% of total imports. The total import volume of the top 5 regions was 69,300 tonnes, accounting for 90.79%.
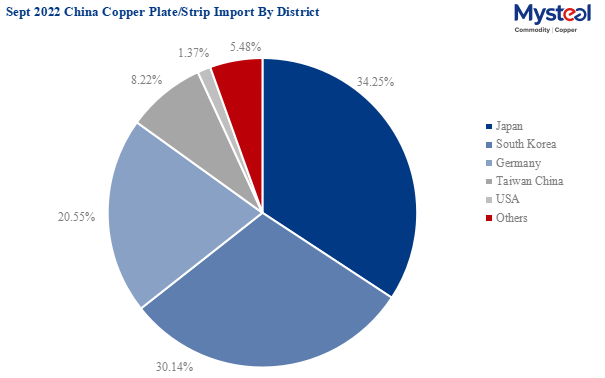
Data Source: Custom, Mysteel
| Sept 2022 China Copper Plate/Strip Import by District | |||||
| Country/District | Sept Import(kt) | MoM | YoY | Accumulative Import (kt) | Accumulative YoY |
| Japan | 2.5 | -16.9% | -30.7% | 29.9 | -10.9% |
| South Korea | 2.2 | 25.7% | -13.3% | 18.4 | -18.8% |
| Germany | 1.5 | 2.4% | -17.3% | 12.8 | -26.9% |
| Taiwan China | 0.6 | -6.5% | -28.1% | 6.4 | -45.8% |
| USA | 0.1 | 40.1% | -47.5% | 1.2 | -43.5% |
| Others | 0.4 | -49.8% | -59.3% | 7.6 | -46.1% |
| Total | 7.3 | -5.6% | -26.6% | 76.3 | -20.9% |
| Data Source: Customs | |||||
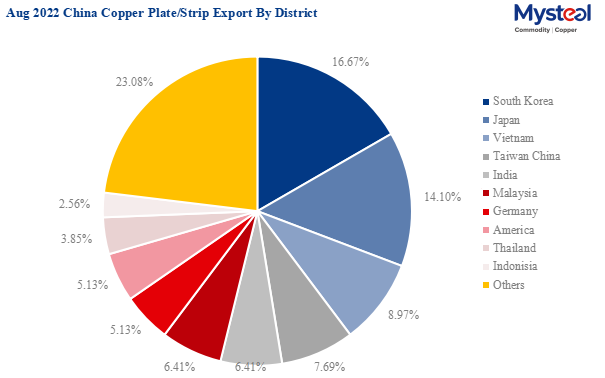
The export volume of copper plate/strip in China was relatively balanced and the areas are relatively scattered. In September 2022, the top 10 export countries/regions of copper plate/strip of China are South Korea, Japan, Vietnam, Taiwan province of China, India, Malaysia, Indonesia, Thailand, the United States, and Germany. The export volume to them was 6,000 tonnes, accounting for 77.07% of the total export volume, which decreased by 4.43% month on month and 4.52% year on year.
From January to September 2022, a total of 57,900 tonnes of copper plates/strips were exported to the top 10 export countries/regions, accounting for 74.5%, which increased by 53.56% year on year.
Data Source: Custom, Mysteel
| Sept 2022 China Copper Plate/Strip Export by District | |||||
| Country/District | Sept Export(kt) | MoM | YoY | Accumulative Export (kt) | Accumulative YoY |
| South Korea | 1.3 | -18.1% | 49.2% | 10.9 | 213.0% |
| Japan | 1.1 | -12.6% | -22.0% | 8.9 | 21.5% |
| Vietnam | 0.7 | 5.6% | -41.9% | 8.1 | -9.4% |
| Taiwan China | 0.6 | 6.8% | -41.8% | 5.2 | 23.4% |
| India | 0.5 | 16.7% | 47.3% | 4.0 | 26.5% |
| Malaysia | 0.5 | 22.1% | 9.9% | 4.3 | 6.3% |
| Indonesia | 0.4 | 29.9% | 53.5% | 2.7 | 56.7% |
| Thailand | 0.4 | 2.5% | -7.1% | 3.9 | 14.3% |
| America | 0.3 | -16.6% | 101.4% | 4.3 | 720.5% |
| Germany | 0.2 | -34.3% | -4.9% | 5.6 | 528.3% |
| Others | 1.8 | -16.9% | -2.0% | 19.8 | 22.6% |
| Total | 7.8 | -7.6% | -4.0% | 77.7 | 44.3% |
| Data Source: Customs | |||||
For queries and more information/data/reports access, please contact Paula Xu at xuzhongping@mysteel.com
Copper strip prices: Luoyang
Mar 06, 2026 11:56
Copper strip prices: Guangzhou
Mar 06, 2026 11:55
Copper strip prices: Ningbo
Mar 06, 2026 11:54
Copper strip prices: Yantai
Mar 06, 2026 11:54
Copper strip prices: Shijiazhuang
Mar 06, 2026 11:53
