I. Overview
China's new energy vehicles (NEVs) production extended stable growth in August, through the monthly rate slowed compared with the same month in 2021 (8.8%) and 2022 (12%) mainly because the calculation base has been mounting continuously. However, it also mirrored the market confidence towards the follow-up market to some extent.
In detail, China's NEV production reported 843,000 units in August, rising 4.7% month on month (MoM) and 22% year on year (YoY). The production totaled 5.44 million units year-to-date (YTD), an increase of 37.2% from last year.
The combined production of NEVs and traditional fuel vehicles, on the other hand, jumped 7.2% MoM and 7.5% YoY at 2.58 million units in August, or climbed 4.4% from 2022 at 17.7 million units YTD.
Figure 1-1. China NEVs Production
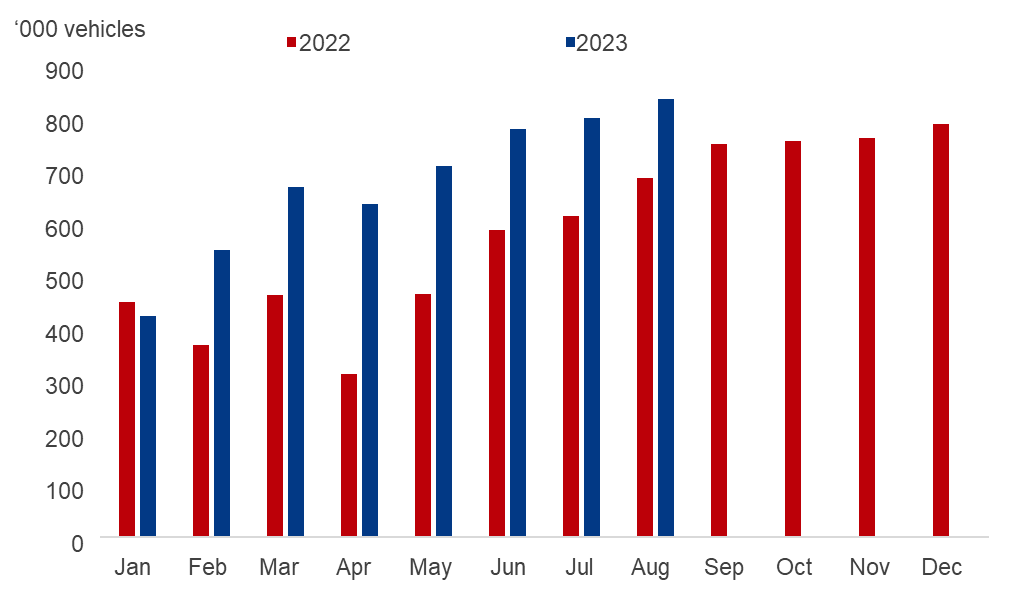
Source: China Association of Automobile Manufacturers (CAAM), Mysteel
Regarding the sales, the volume was 846,000 units in August, marking a monthly growth of 8.5% and an annual increase of 27%. The sales totaled 5.37 million units YTD, up 39.5% YoY.
For NEVs and traditional fuel vehicles combined, the sales volume added 8.2% MoM and 8.4% YoY at 2.58 million units alone in August, or 17.71 million units YTD, rising 5.1% from 2022.
The sales situation of NEVs picked up in August, but the monthly growth rate slowed compared with 2021 (18.5%) and 2022 (12.3%) also due to booming calculation base.
Figure 1-2. China NEVs Production
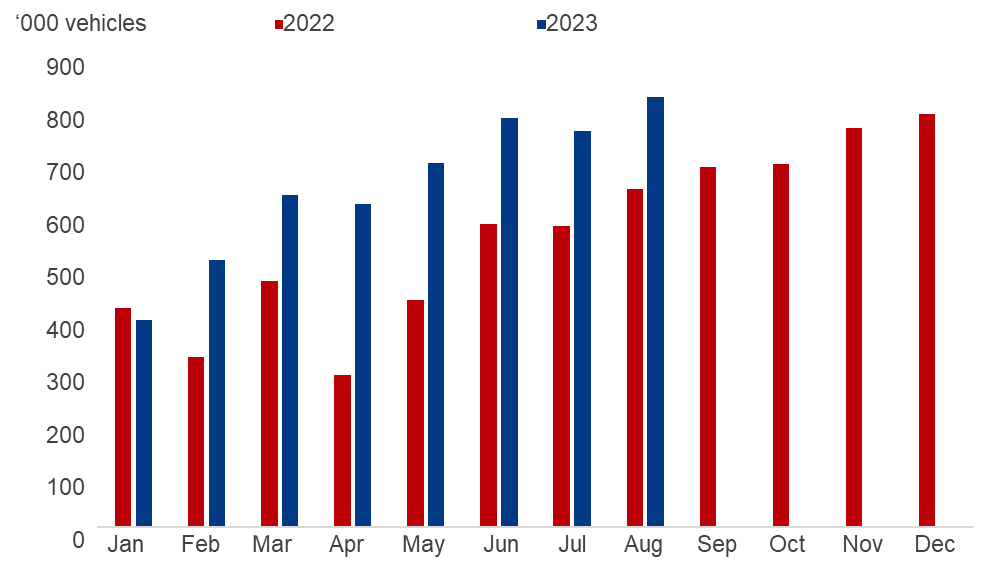
Source: CAAM, Mysteel
The cumulative NEVs inventory stood at 249,000 units in August, down 3,000 units from July, but climbing 97.6% from last year. Though the inventory remained high, the actual marketable NEVs inventory shall be lower than this level considering the cumulation of outdated models and marginal inventory of new models.
Figure 1-3. China NEVs Cumulative Inventory (June 2021-Aug 2023)
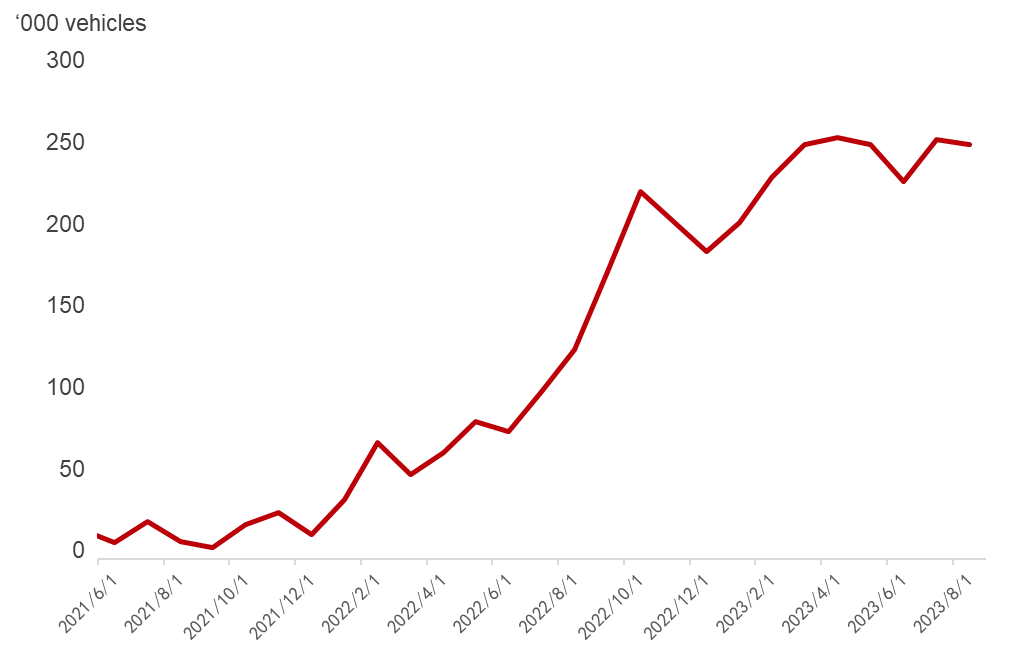
Source: Mysteel
China's NEVs exports reported 90,000 units in August, down 11.2% MoM but up 41% YoY. The YTD exports were 727,000 units, rising 113.8% from last year.
Figure 1-4. China NEVs Exports
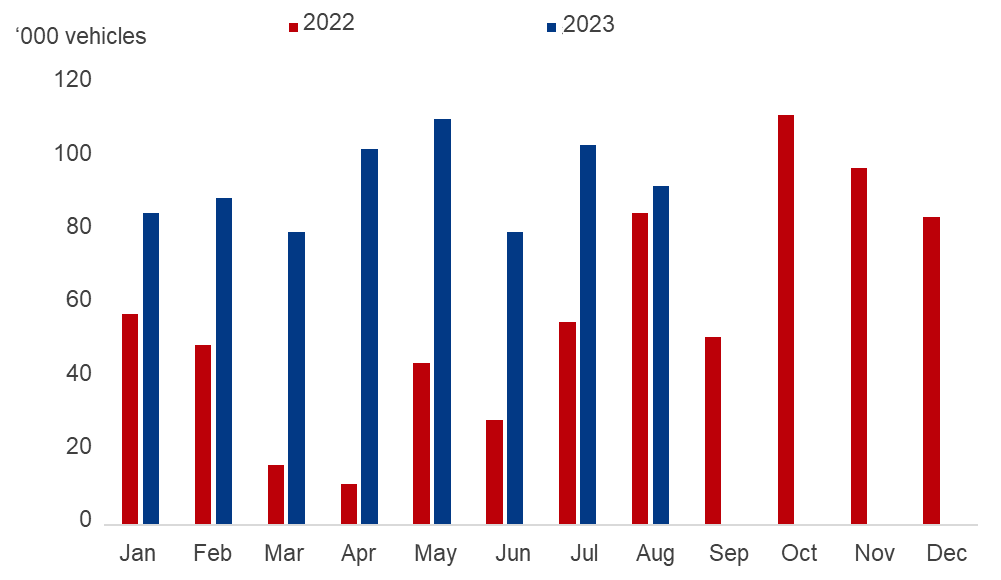
Sources: CAAM, Mysteel
In summary, the NEVs sales situation outperformed the production side, hence the inventory dropped slightly. The slowing production growth was mainly attributed to the expiry of government subsidies, which damped carmakers' confidence towards the follow-up market. The sales volume, on the other hand, was boosted by relaxing macroeconomic policies that fueled the customers' appetite.
II. NEV market breakdown by energy type, class, and brand
The analysis in this sector is based on the actual number of new energy passenger vehicles (which took up more than 80% of NEVs) insured with compulsory traffic insurance in August, as it gauges only the vehicles that are actually running on the road.
For new energy passenger vehicles (NEPVs), battery electric vehicles (BEVs) still took the lion's share of 65.2%, followed by hybrid plug-in electric vehicles (PHEVs) with a share of 19.1%.
Figure 1-5. NEPVs Insurance Volume by Energy Type
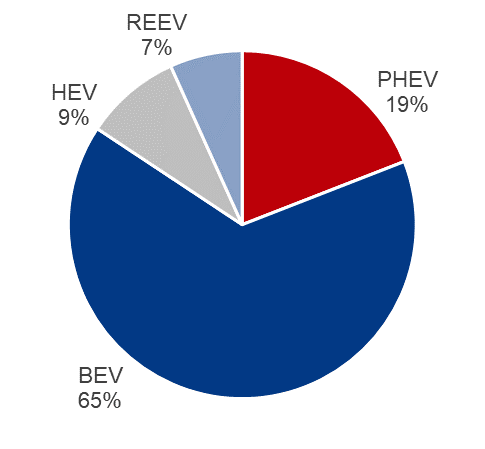
Source: Mysteel
From a month-on-month perspective, the insurance volume of NEVs jumped across all energy types except for hybrid electric vehicles (HEVs), which fell 0.3% MoM at 66,000 units in August. Specially, the insurance volume of range extended electric vehicles (REEVs) increased for three months in a row.
Table 1-1. NEPVs Insurance Volume in August
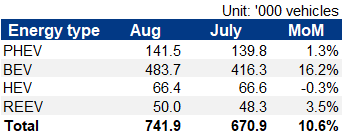
Source: Mysteel
Regarding vehicle class, class A NEPVs rose the fastest by 14.5% MoM in August concerning the insurance volume, followed by class B vehicles.
Table 1-2. NEPVs Insurance Volume by Class
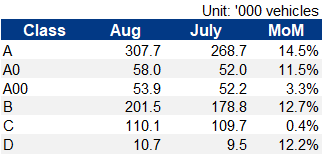
Source: Mysteel
Taken energy type and vehicle class together, the class A and class B BEVs contributed the most to the monthly growth of NEVs sales volume in August, which stood at 168,000 units and 131,000 units respectively.
Table 1-3. Monthly Growth of NEPVs Insurance Volume by Energy Type and Class
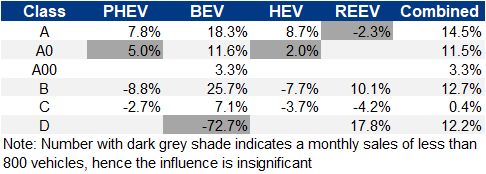
Source: Mysteel
When looking at specific NEV brands, apart from BYD which secured the crown, Tesla regained its momentum and ranked second as its August production mainly supplied the domestic market, against the exports of 19,700 units, down 40% MoM.
Table 1-4. August NEPVs Insurance Volume by Brand
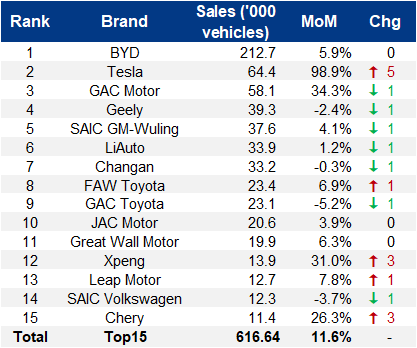
Source: Mysteel
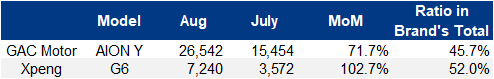
While the outperformance of specific brands is mostly due to the popularity of certain models, AION Y and XPeng X6 demonstrated exciting monthly sales growth in August, which fueled the overall sales of GAC Motor and XPeng.
Table 1-5. Sales Performance of Selected Brands in August
Source: Mysteel
Conclusion:
China's NEVs sales outperformed the production in August, but slowed compared with 2021 and 2022, indicating insufficient confidence among carmakers towards the follow-up market. Nevertheless, the customers' demand is expected to be unleashed with the introduction of new stimulus policies in the near future to ensure the heathy development of the industry chain.
Written by Aggie Hu, huchenying@mysteel.com