1. Import and export volume of copper plate/strip
1.1 China mainland's Oct copper plate/strip imports increase by 9.50% MoM
China mainland's copper plate/strip import increased by 643 tonnes or 9.50% month on month to 7,407 tonnes, and the increase was mainly from Japan, Indonesia and Thailand, which increased by 304 tonnes, 118 tonnes and 113 tonnes respectively month on month, according to the General Administration of Customs of the People's Republic of China (GACC). However, it decreased by 355 tonnes or 4.57% year on year. As of October, the total imports of copper plate/strip in 2023 decreased by 21,572 tonnes or 25.67% year on year to 62,465 tonnes.
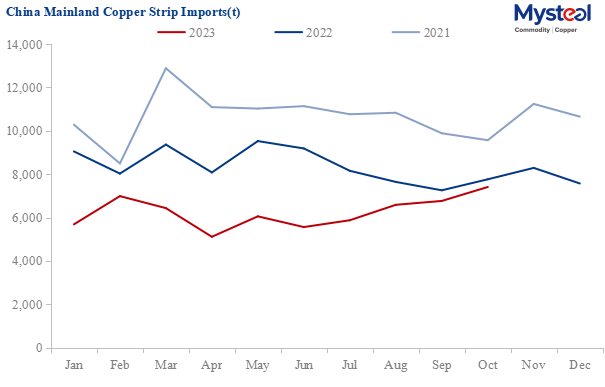
Data Source: GACC, Mysteel
1.2 China mainland's Oct copper plate/strip exports decrease by 4.78% MoM
China mainland's copper plate/strip export decreased by 404 tonnes or 4.78% month on month while increased by 29 tonnes or 0.37% year on year to 8,046 tonnes in October, according to GACC. Thus, the total copper plate/strip exports decreased by 70 tonnes or 0.08% year on year to 85,615 tonnes in January-October.
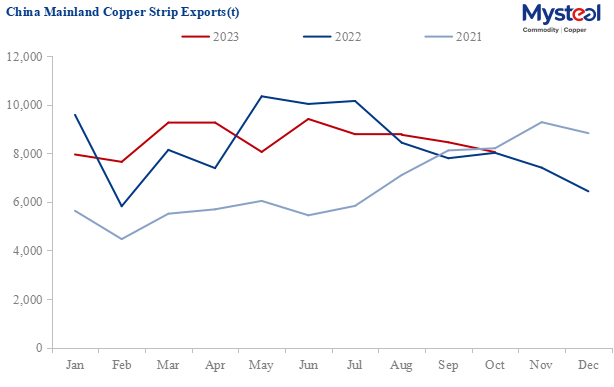
Data Source: GACC, Mysteel
1.3 China mainland's Oct copper plate/strip net imports increase by 62.10% MoM
China mainland's copper plate/strip net imports increased by 62.10% month on month but decreased by 151.25% year on year to -639 tonnes in October. The total net imports decreased by 1304.30% year on year to -23,150 tonnes in January-October.
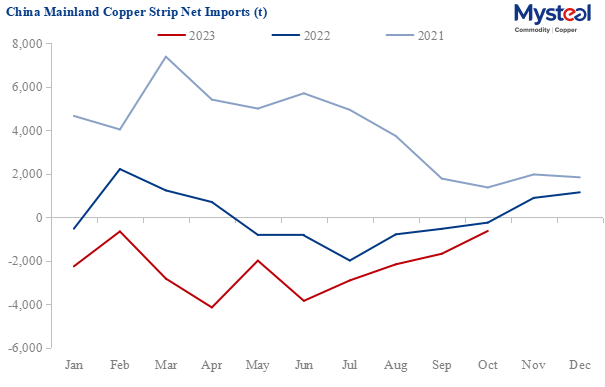
Data Source: GACC, Mysteel
2. Major import and export countries/regions
2.1 Top five countries/regions for imports
China mainland's copper plate/strip imports in October were relatively concentrated in Japan, South Korea, Germany, Taiwan China, and Finland. The imports from these top five countries/regions were 6,943 tonnes, which accounted for 93.73% of the total. Wherein, Japan, South Korea, and Germany were the top three countries, and exported 6,249 tonnes to China mainland in October, accounting for 84.37% of China's copper plate/strip total imports.
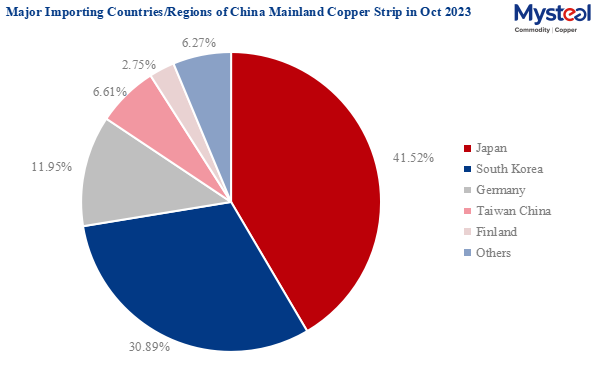
Data Source: GACC, Mysteel
| Major Importing Countries/Regions of China Mainland Copper Strip in Oct 2023 | |||||
| Countries/Regions | Import in Oct 2023 (kt) | MoM | YoY | Import in Jan-Oct 2023 (kt) | YoY |
| Japan | 3.1 | 10.96% | -9.85% | 24.9 | -25.20% |
| South Korea | 2.3 | 3.21% | 8.14% | 19.1 | -6.54% |
| Germany | 0.9 | 4.37% | -25.54% | 9.1 | -34.85% |
| Taiwan China | 0.5 | -10.72% | -5.67% | 4.8 | -30.78% |
| Finland | 0.2 | 18.25% | 80.48% | 1.6 | -4.80% |
| Others | 0.4 | 124.87% | 12.40% | 3 | -61.68% |
| Total | 7.4 | 9.50% | -4.57% | 62.5 | -25.67% |
| Data Source: GACC, Mysteel | |||||
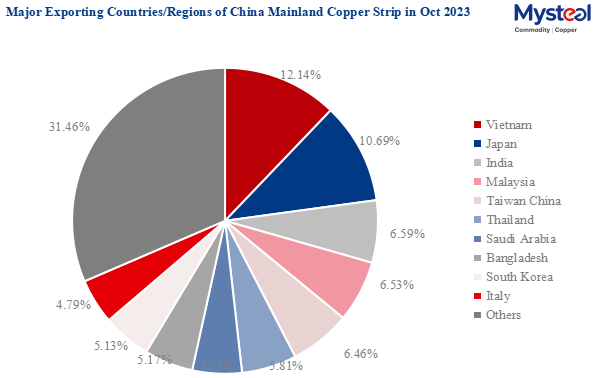
2.2 Top ten countries/regions for exports
China mainland's exports of copper plate/strip were relatively balanced and scattered. The top ten countries/regions whose imports from China mainland in October decreased by 6.80% year on year to 5,515 tonnes, accounting for 68.54% of China mainland's total copper plate/strip exports, were Vietnam, Japan, India, Malaysia, Taiwan China, Thailand, Saudi Arabia, Bangladesh, South Korea, and Italy.
Data Source: GACC, Mysteel
| Major Exporting Countries/Regions of China Mainland Copper Strip in Oct 2023 | |||||
| Countries/Regions | Export in Oct 2023 (kt) | MoM | YoY | Export in Jan-Oct 2023 (kt) | YoY |
| Vietnam | 10 | -12.51% | 25.14% | 10.1 | 14.22% |
| Japan | 9 | 22.05% | -26.48% | 7.7 | -22.88% |
| India | 5 | -19.36% | -21.06% | 6.2 | 30.73% |
| Malaysia | 5 | -19.36% | -7.76% | 4.7 | -3.44% |
| Taiwan China | 5 | -16.25% | 28.56% | 4.6 | -17.51% |
| Thailand | 5 | 20.35% | -23.50% | 4.2 | -7.06% |
| Saudi Arabia | 4 | 94.13% | 368.88% | 1.7 | 26.41% |
| Bangladesh | 4 | 129.12% | 183.04% | 2.5 | 0.90% |
| South Korea | 4 | -30.49% | -70.32% | 9.9 | -19.76% |
| Italy | 4 | 15.60% | 374.84% | 3.2 | 1113.17% |
| Others | 25 | -15.19% | 20.56% | 30.8 | 0.28% |
| Total | 80 | -4.78% | 0.37% | 85.6 | -0.08% |
| Data Source: GACC, Mysteel | |||||
Written by Edenlis Huang, huangting@mysteel.com
Edited by Paula Xu, xuzhongping@mysteel.com