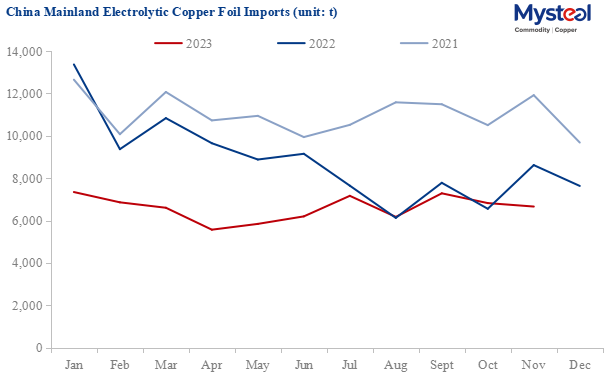
China's Nov copper foil imports decrease by 22.69% YoY and 2.39% MoM to 6,660t
China's refined copper foil (without backing, thickness ≤ 0.15 mm) imports decreased by 1,955 tonnes or 22.69% year on year and 163 tonnes or 2.39% month on month to 6,660 tonnes in November 2023, and the cumulative imports in January-November decreased by 25,445 tonnes or 25.98% year on year to 72,511 tonnes, according to the General Administration of Customs of the People's Republic of China (GACC).
Data Source: GACC, Mysteel
Taiwan province was still the largest source region of China mainland's copper foil imports, accounting for 72.92%, with an import increase of 2.77% month on month in November. Imports from South Korea decreased by 18.19% month on month in November, which was China mainland's second-largest source of copper foil imports. Malaysia, Japan and Luxembourg were the third to fifth largest source regions of China's mainland copper foil imports. The average import price in November decreased by Yuan 629/tonne to Yuan 108640/tonne. Among the main importing countries and regions, the average price of copper foil imported from Germany was the highest. The import price of copper foil from Taiwan China and Luxembourg was lower than the average import price.
| Sources for China's Backless Refined Copper Foil Imports | |||||
| Countries/Regions | Import in Nov 2023 (t) | Proportion | Average Import Price (Yuan/t) | MoM | YoY |
| Taiwan, China | 4,856 | 72.92% | 94,840 | 2.77% | -17.97% |
| Japan | 319 | 4.78% | 159,573 | -8.46% | 23.95% |
| Malaysia | 384 | 5.76% | 163,236 | -13.07% | -59.46% |
| South Korea | 713 | 10.70% | 119,953 | -18.19% | -37.33% |
| Germany | 46 | 0.69% | 179,948 | 71.22% | 15.81% |
| Luxembourg | 259 | 3.88% | 84,871 | -22.08% | -3.98% |
| Philippines | 76 | 1.14% | 207,637 | 13.85% | 95.44% |
| Others | 8 | 0.12% | - | - | - |
| Total | 6,660 | 100.00% | 108,640 | -2.39% | -22.69% |
| Data Source: GACC, Mysteel | |||||
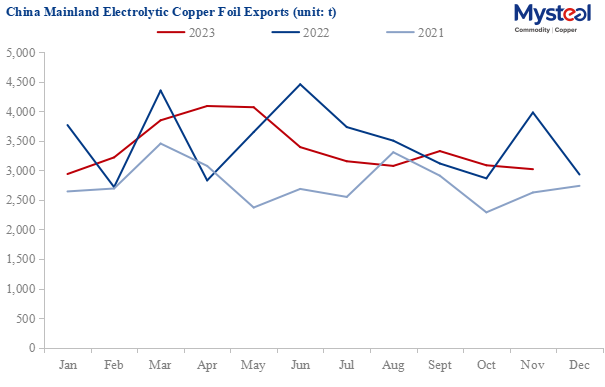
China's Nov copper foil exports decrease by 24.12% YoY and 2.15% MoM to 3,018t
China's refined copper foil (without backing, thickness ≤ 0.15 mm) exports decreased by 959 tonnes or 24.12% year on year and 66 tonnes or 2.15% month on month to 3,018 tonnes in November 2023, and the cumulative exports in January-November decreased by 1,745 tonnes or 4.48% year on year to 37,196 tonnes, according to the GACC.
Data Source: GACC, Mysteel
There were a total of 56 destination countries and regions where China exported copper foil in November, with Thailand, Malaysia, Saudi Arabia, Egypt, and South Korea being the top five countries, accounting for 15.52%, 15.48%, 14.42%, 11.82% and 10.35% of the cumulative export volume respectively. Exports to Thailand decreased by 153 tonnes or 24.62% month on month in November.
| Destinations for China's Backless Refined Copper Foil Exports | |||||
| Countries/Regions | Export in Nov 2023 (t) | Proportion | Average Export Price (Yuan/t) | MoM | YoY |
| South Korea | 312 | 10.35% | 89,521 | -5.25% | -22.72% |
| Malaysia | 467 | 15.48% | 79,769 | -43.90% | 71.06% |
| India | 24 | 0.80% | 83,964 | 586.84% | -6.95% |
| Japan | 23 | 0.77% | 137,493 | -26.30% | -26.39% |
| Vietnam | 154 | 5.10% | 81,903 | -9.04% | 39.06% |
| Taiwan, China | 143 | 4.75% | 87,089 | 1.94% | -66.07% |
| Indonesia | 146 | 4.84% | 72,453 | 66.42% | 55.49% |
| Thailand | 468 | 15.52% | 78,186 | -24.62% | -20.73% |
| Turkey | 58 | 1.93% | 70,630 | 62.22% | 58.37% |
| Germany | 31 | 1.01% | 72,671 | 2357.38% | 378.50% |
| Hongkong, China | 18 | 0.59% | 139,133 | -3.75% | -41.35% |
| Egypt | 357 | 11.82% | 67,071 | 29.09% | 1.86% |
| Saudi Arabia | 435 | 14.42% | 64,748 | 101.67% | -8.90% |
| Spain | 25 | 0.84% | 68,679 | 2559.08% | -4.24% |
| Pakistan | 139 | 4.60% | 64,715 | 236.93% | 216.97% |
| Brazil | 12 | 0.39% | 70,492 | 11.72% | 580.17% |
| Peru | 11 | 0.37% | 75,450 | 58.90% | 110320.00% |
| Australia | 7 | 0.25% | 72,882 | -4.68% | 5.78% |
| Romania | 12 | 0.41% | 73,055 | 612850.00% | -31.85% |
| Macau, China | 15 | 0.49% | 81,690 | 100.00% | 0.24% |
| Bangladesh | 9 | 0.31% | 72,280 | 156.92% | 517.13% |
| Norway | 6 | 0.20% | 103,778 | 4102.13% | 100.00% |
| Jordan | 20 | 0.66% | 69,971 | 100.00% | -56.60% |
| Algeria | 75 | 2.50% | 60,857 | 285.62% | 100.00% |
| Others | 49 | 1.62% | - | - | - |
| Total | 3,018 | 100.00% | 76,579 | -2.15% | -24.12% |
| Data Source: GACC, Mysteel | |||||
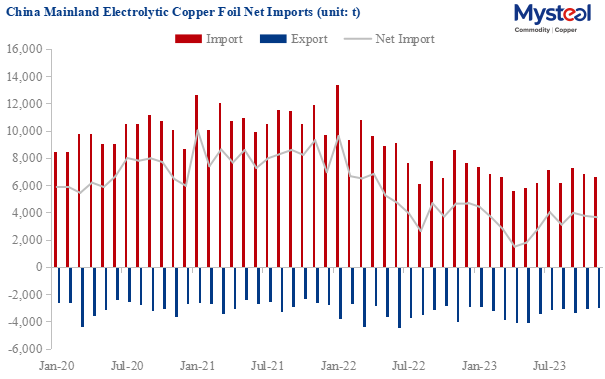
In summary, China's imports and exports both decreased month on month in November, mainly due to a severe decline in market demand. The finished product inventory of domestic and overseas downstream customers remained high and did not usher in the expected peak consumption season. The previous high opening rate led to significant sales pressure, forcing processing enterprises to shrink their operations. Owing to the weak production and demand in the domestic copper foil market in December, it is expected that imports and exports will further fall.
Data Source: GACC, Mysteel
Written by Edenlis Huang, huangting@mysteel.com
Edited by Paula Xu, xuzhongping@mysteel.com