China's Jul copper foil import decrease by 6.27% YoY but increase by 15.66% MoM to 7,165t
China's refined copper foil (without backing, thickness ≤ 0.15 mm) imports decreased by 479 tonnes or 6.27% year on year while increased by 970 tonnes or 15.66% month on month to 7,165 tonnes in July 2023, and the total imports in Jan-Jul decreased by 23,308 tonnes or 33.84% year on year to 45,574 tonnes, according to the General Administration of Customs of the People's Republic of China (GACC).
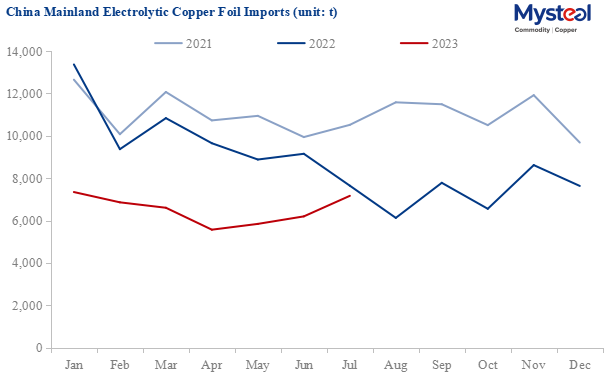
Data Source: GACC, Mysteel
Taiwan province was still the largest source region of China mainland's copper foil imports, accounting for 64.30%, with an import increase of 20.04% month on month in July. Imports from Japan decreased by 6.94% month on month in July, which was China's second-largest source of copper foil imports. Malaysia, South Korea and Luxembourg were the third to fifth largest source regions of China's mainland copper foil imports. The decrease in the amount of copper foil imported from Europe and America was much greater than that of Asia. The US source was still with the highest price which was over Yuan 1 million/tonne, while prices of copper foil imported from Taiwan, China, and Luxembourg were lower than the average this month.
| Sources for China's Backless Refined Copper Foil Imports | |||||
| Countries/Regions | Import in Jul 2023 (t) | Proportion | Average Import Price (Yuan/t) | MoM | YoY |
| Taiwan, China | 4,822 | 67.30% | 92,190 | 20.04% | 4.83% |
| Japan | 235 | 3.28% | 163,861 | -6.94% | -14.45% |
| Malaysia | 677 | 9.45% | 144,210 | 10.33% | -23.26% |
| South Korea | 974 | 13.59% | 118,335 | -1.12% | -20.96% |
| Germany | 31 | 0.43% | 164,380 | 15.81% | 0.18% |
| US | 3 | 0.05% | 1,604,477 | -37.23% | -71.40% |
| Philippines | 41 | 0.57% | 237,487 | -15.47% | -79.36% |
| Luxembourg | 371 | 5.18% | 91,675 | 50.47% | -4.24% |
| Netherlands | 9 | 0.12% | 99,684 | 100.00% | -66.59% |
| Total | 7,165 | 100.00% | 104,872 | 15.66% | -6.27% |
| Data Source: GACC, Mysteel | |||||
China's Jul copper foil exports decrease by 15.50% YoY and 7.05% MoM to 3,152t
China's refined copper foil (without backing, thickness ≤ 0.15 mm) exports decreased by 578 tonnes or 15.50% year on year and 239 tonnes or 7.05% month on month to 3,152 tonnes in July 2023, and the total exports in Jan-Jul decreased by 791 tonnes or 3.10% year on year to 24,695 tonnes, according to the GACC.
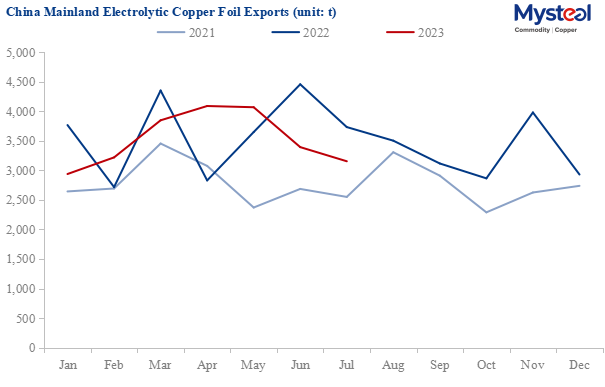
Data Source: GACC, Mysteel
There were a total of 34 destination countries and regions where China exported copper foil in July, with Thailand, Malaysia, South Korea, Egypt and Saudi Arabia being the five top countries, accounting for 20.26%, 13.21%, 10.06%, 9.76%, and 8.56% of the total export volume respectively. Exports to Egypt decreased by 796 tonnes or 72.14% month on month in July, which was the main drag for the overall decrease in exports.
| Destinations for China's Backless Refined Copper Foil Exports | |||||
| Countries/Regions | Export in Jul 2023 (t) | Proportion | Average Export Price (Yuan/t) | MoM | YoY |
| South Korea | 317 | 10.06% | 91,445 | -3.38% | -32.41% |
| Japan | 57 | 1.80% | 94,717 | 84.12% | -8.01% |
| Vietnam | 129 | 4.09% | 77,768 | -17.73% | -20.56% |
| India | 54 | 1.71% | 81,264 | 105.21% | 156.67% |
| Indonesia | 95 | 3.03% | 70,073 | 240.43% | -7.52% |
| Thailand | 639 | 20.26% | 79,438 | 34.79% | 22.90% |
| Malaysia | 417 | 13.21% | 108,264 | 62.22% | -44.75% |
| Hongkong, China | 18 | 0.56% | 107,283 | -66.46% | 979.63% |
| Taiwan, China | 268 | 8.49% | 71,778 | -7.27% | 620.01% |
| Saudi Arabia | 270 | 8.56% | 66,591 | 15.29% | 29.76% |
| Brazil | 22 | 0.70% | 70,379 | 187.36% | 560.25% |
| Germany | 20 | 0.64% | 80,354 | 141.11% | 374.41% |
| Egypt | 308 | 9.76% | 69,366 | -72.14% | -56.17% |
| Mexico | 41 | 1.29% | 72,437 | 1051.23% | 99.97% |
| Poland | 98 | 3.12% | 115,236 | 20496.44% | 100.00% |
| UAE | 42 | 1.33% | 67,221 | 320.23% | -32.95% |
| Turkey | 38 | 1.19% | 71,423 | -54.53% | 55.41% |
| Pakistan | 66 | 2.09% | 68,278 | 47.49% | -44.98% |
| Peru | 18 | 0.56% | 73,351 | 154.02% | 95.00% |
| Canada | 15 | 0.49% | 73,672 | 100.00% | 100.00% |
| Bangladesh | 5 | 0.16% | 71,535 | -10.52% | 923.33% |
| Sri Lanka | 5 | 0.17% | 71,953 | 892.38% | 565.71% |
| Chile | 6 | 0.20% | 73,227 | 49.72% | 514.61% |
| Romania | 12 | 0.39% | 69,078 | 12.22% | 100.00% |
| Portugal | 21 | 0.67% | 68,725 | 100.00% | 100.00% |
| Spain | 25 | 0.79% | 74,080 | 972.09% | 18.27% |
| Argentina | 6 | 0.19% | 87,374 | 2952.50% | 67733.33% |
| Macao, China | 16 | 0.50% | 84,590 | 3.06% | -47.26% |
| Hungary | 17 | 0.54% | 70,019 | -0.69% | 100.00% |
| Qatar | 51 | 1.62% | 67,586 | 100.00% | 920.82% |
| Columbia | 4 | 0.14% | 74,782 | 100.00% | -77.28% |
| Australia | 16 | 0.52% | 72,124 | -41.33% | -32.09% |
| Sweden | 17 | 0.54% | 72,038 | 239.92% | -70.65% |
| Total | 3,152 | 100.00% | 82,071 | -7.05% | -15.50% |
| Data Source: GACC, Mysteel | |||||
In summary, China imported more and exported less of copper foil in July, increasing net imports. Mainly because the domestic consumption of electronic products, especially high-end electronic products, improved continuously. Besides, some domestic circuit copper foil production lines had shifted to produce lithium battery copper foil whose production capacity was in short supply, so there was no big change in the overall supply of copper foils. However, the net imports are expected to fall back in August based on a recovery growth of exports with increasingly abundant supply and a further increase in imports with a stable improvement of the electronic market.
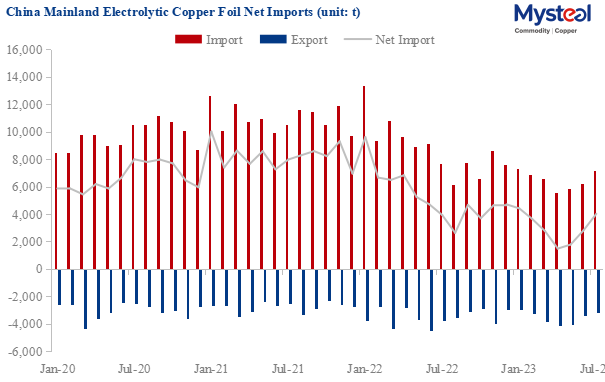
Data Source: GACC, Mysteel
Written by Edenlis Huang, huangting@mysteel.com
Edited by Paula Xu, xuzhongping@mysteel.com