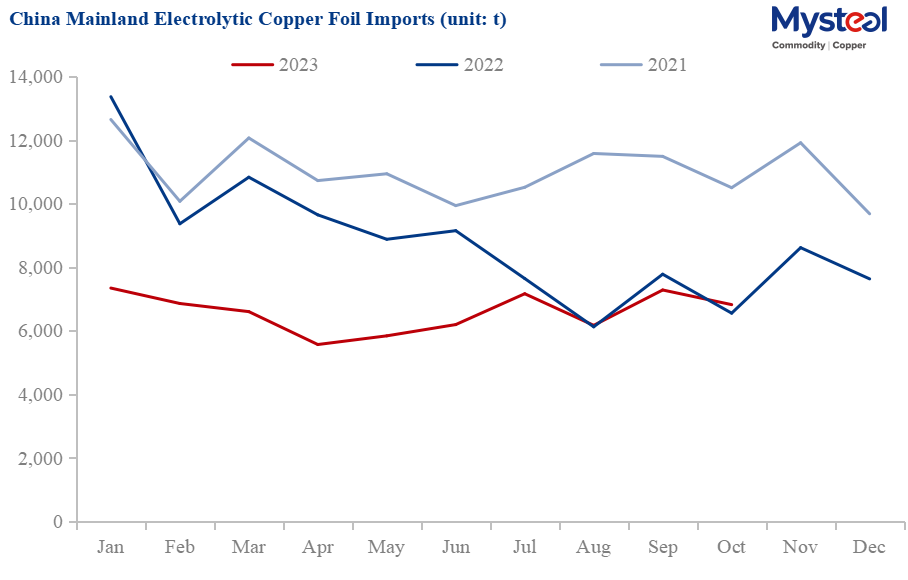
China's Oct copper foil imports increase by 4.09% YoY but decrease by 6.33% MoM to 6,823t
China's refined copper foil (without backing, thickness ≤ 0.15 mm) imports increased by 268 tonnes or 4.09% year on year while decreased by 461 tonnes or 6.33% month on month to 6,823 tonnes in October 2023, and the total imports in January-October decreased by 23,490 tonnes or 26.29% year on year to 65,851 tonnes, according to the General Administration of Customs of the People's Republic of China (GACC).
Data Source: GACC, Mysteel
Taiwan province was still the largest source region of China mainland's copper foil imports, accounting for 69.26%, with an import decrease of 4.85% month on month in October. Imports from South Korea decreased by 4.91% month on month in October, which was China mainland's second-largest source of copper foil imports. Malaysia, Japan and Luxembourg were the third to fifth largest source regions of China mainland's copper foil imports. The price of the US source remained the highest at over Yuan 1 million/tonne, while prices of copper foil imported from Taiwan province and Luxembourg were lower than the average.
| Sources for China's Backless Refined Copper Foil Imports | |||||
| Countries/Regions | Import in Oct 2023 (t) | Proportion | Average Import Price (Yuan/t) | MoM | YoY |
| Taiwan, China | 4,725 | 69.26% | 94,552 | -4.85% | 11.71% |
| Japan | 348 | 5.10% | 155,119 | 23.03% | 63.14% |
| South Korea | 871 | 12.77% | 117,676 | -4.91% | -21.55% |
| Malaysia | 442 | 6.47% | 176,343 | -40.72% | -37.55% |
| Germany | 27 | 0.39% | 234,869 | -10.36% | 24.43% |
| US | 10 | 0.15% | 1,237,802 | 82.86% | -26.61% |
| Luxembourg | 332 | 4.86% | 93,486 | 23.72% | 61.86% |
| Philippines | 67 | 0.98% | 215,701 | 6.63% | 136.41% |
| Others | 1 | 0.02% | - | - | - |
| Total | 6,823 | 100.00% | 109,269 | -6.33% | 4.09% |
| Data Source: GACC, Mysteel | |||||
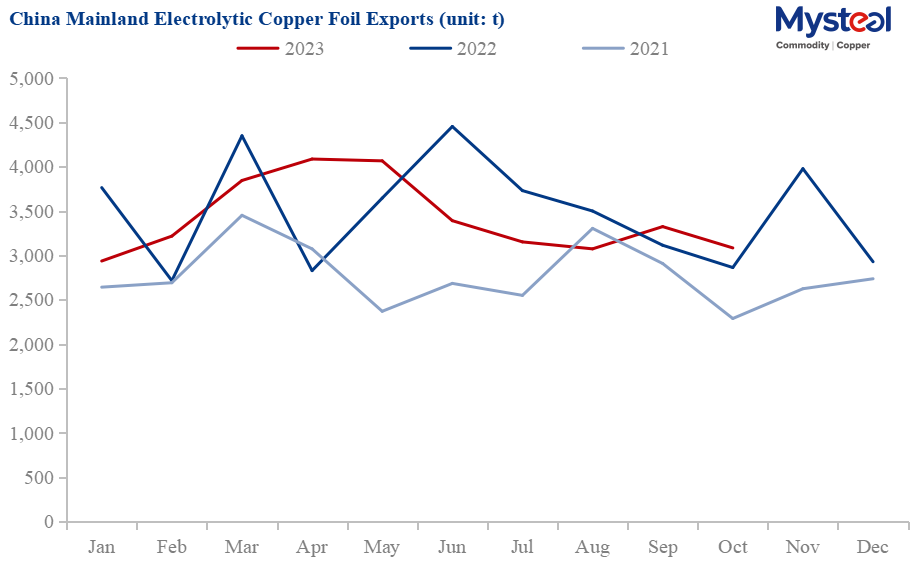
China's Oct copper foil exports increase by 7.72% YoY while decrease by 7.23% MoM to 3,084t
China's refined copper foil (without backing, thickness ≤ 0.15 mm) exports increased by 221 tonnes or 7.72% year on year while decreased by 240 tonnes or 7.23% month on month to 3,084 tonnes in October 2023, and the total exports in January-October decreased by 786 tonnes or 2.25% year on year to 34,178 tonnes, according to the GACC.
Data Source: GACC, Mysteel
There were a total of 58 destination countries and regions where China exported copper foil in October. Malaysia exported 833 tonnes, accounting for 27% of the total volume, and was the largest destination country for copper foil exports from China in October. Thailand, South Korea, and Vietnam ranked among the top two to four destination countries for Chinese copper foil exports. The top four countries together accounted for 66.33% of China's total exports in October.
| Destinations for China's Backless Refined Copper Foil Exports | |||||
| Countries/Regions | Export in Oct 2023 (t) | Proportion | Average Export Price (Yuan/t) | MoM | YoY |
| South Korea | 330 | 10.69% | 91,695 | -19.22% | -38.24% |
| Thailand | 622 | 20.15% | 80,967 | -26.96% | 36.79% |
| Malaysia | 833 | 27.00% | 77,791 | 75.12% | 177.54% |
| Indonesia | 88 | 2.84% | 91,865 | 3.44% | 29.63% |
| Japan | 31 | 1.02% | 100,030 | -11.30% | 25.80% |
| Vietnam | 169 | 5.48% | 80,802 | 1.91% | 52.15% |
| Taiwan, China | 141 | 4.56% | 77,145 | -17.80% | -54.66% |
| Brazil | 11 | 0.34% | 81,652 | 353000.00% | 657.18% |
| Hongkong, China | 19 | 0.60% | 123,672 | 16.18% | 25.71% |
| Qatar | 49 | 1.60% | 65,416 | 704800.00% | 2560.00% |
| Philippines | 6 | 0.18% | 69,155 | 1836.24% | -45.05% |
| Turkey | 36 | 1.17% | 70,564 | 1.34% | -48.45% |
| Pakistan | 41 | 1.34% | 65,274 | -62.54% | -27.07% |
| Singapore | 5 | 0.17% | 152,055 | -78.63% | -43.30% |
| Saudi Arabia | 216 | 6.99% | 67,278 | -33.45% | 108.29% |
| Australia | 8 | 0.26% | 79,102 | 261.53% | -57.65% |
| Egypt | 276 | 8.96% | 68,880 | -35.00% | 64.87% |
| Peru | 7 | 0.23% | 73,842 | -31.27% | 69390.00% |
| UAE | 19 | 0.61% | 68,595 | 1892000.00% | -24.49% |
| Iran | 10 | 0.32% | 68,498 | 100.00% | 100.00% |
| Canada | 9 | 0.28% | 93,013 | -47.12% | -56.86% |
| Hungary | 20 | 0.65% | 75,738 | -51.42% | 107.35% |
| Columbia | 4 | 0.14% | 73,177 | -23.65% | 100.00% |
| Belarus | 19 | 0.63% | 63,888 | 100.00% | 100.00% |
| Kuwait | 57 | 1.86% | 66,654 | 100.00% | 175.74% |
| Algeria | 20 | 0.63% | 71,900 | 78104.00% | 100.00% |
| Others | 38 | 1.30% | - | - | - |
| Total | 3,084 | 100.00% | 79,191 | -7.23% | 7.72% |
| Data Source: GACC, Mysteel | |||||
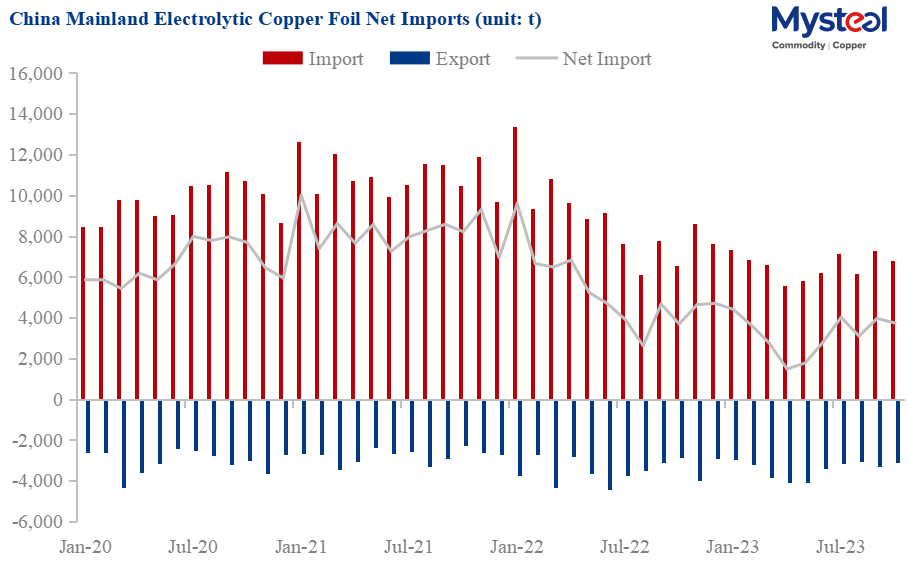
In summary, China's copper foil imports and exports both significantly decreased month on month in October, while net exports continued to contract. The main reason was that the ambiguous trend of copper prices triggered a wait-and-see sentiment among market participants. Most downstream customers tended to consume raw material inventory first rather than increasing procurement. At the same time, the operating rate of leading battery manufacturers declined with the weakening of consumption. The plunge in lithium carbonate prices also intensified market participants' caution towards copper prices.
Data Source: GACC, Mysteel
Written by Edenlis Huang, huangting@mysteel.com
Edited by Paula Xu, xuzhongping@mysteel.com