1. Import and export volume of copper plate/strip
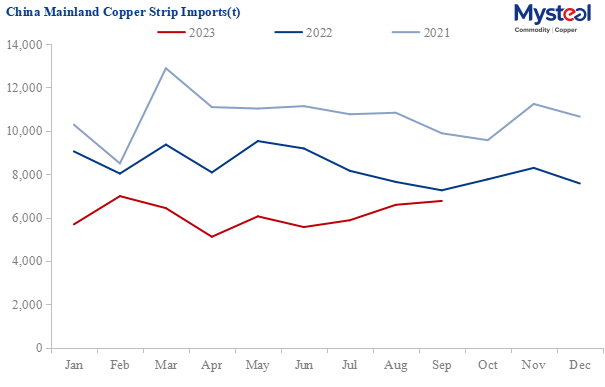
1.1 China mainland's Sept copper plate/strip imports increase by 2.71% MoM
China mainland's copper plate/strip import increased by 179 tonnes or 2.71% month on month to 6,765 tonnes, and the increase was mainly from Japan and South Korea which, increased by 360 tonnes and 184 tonnes respectively month on month, according to the General Administration of Customs of the People's Republic of China (GACC). However, it decreased by 490 tonnes or 6.76% year on year. As of September, the total imports of copper plate/strip in 2023 decreased by 21,217 tonnes or 27.82% year on year to 55,058 tonnes.
Data Source: GACC, Mysteel
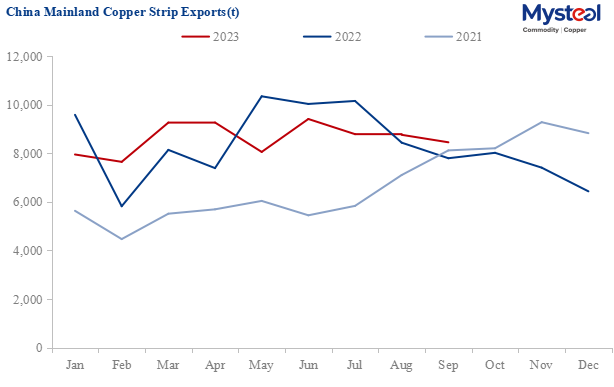
1.2 China mainland's Sept copper plate/strip exports decrease by 3.51% MoM
China mainland's copper plate/strip export decreased by 307 tonnes or 3.51% month on month and 656 tonnes or 8.41% year on year to 8,450 tonnes in September, according to GACC. Thus, the total copper plate/strip exports decreased by 100 tonnes or 0.13% year on year to 77,569 tonnes in January-September.
Data Source: GACC, Mysteel
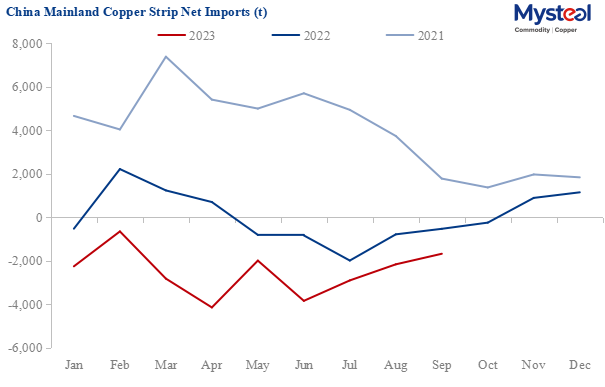
1.3 China mainland's Sept copper plate/strip net imports increase by 22.39% MoM
China mainland's copper plate/strip net imports increased by 22.39% month on month but decreased by 212.76% year on year to -1,685 tonnes in September. The total net imports decreased by 1514.44% year on year to -22,512 tonnes in January-September.
Data Source: GACC, Mysteel
2. Major import and export countries/regions
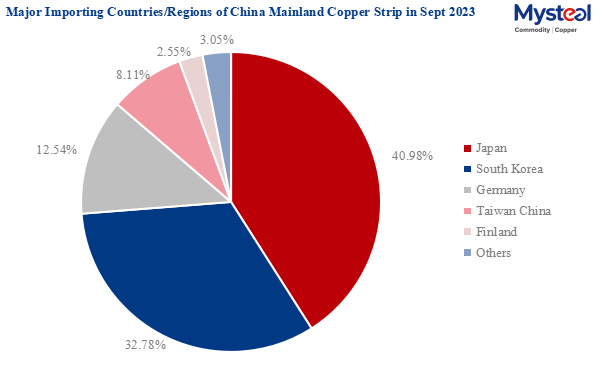
2.1 Top five countries/regions for imports
China mainland's copper plate/strip imports in September were relatively concentrated in Japan, South Korea, Germany, Taiwan China, and Finland. The imports from these top five countries/regions were 6,558 tonnes, which accounted for 96.95% of the total. Japan, South Korea, and Germany were the top three countries, and exported 5,837 tonnes to China mainland in September, accounting for 86.29% of China's copper plate/strip total imports.
Data Source: GACC, Mysteel
| Major Importing Countries/Regions of China Mainland Copper Strip in Sept 2023 | |||||
| Countries/Regions | Import in Sept 2023 (kt) | MoM | YoY | Import in Jan-Sept 2023 (kt) | YoY |
| Japan | 2.8 | 14.95% | 8.92% | 21.8 | -26.95% |
| South Korea | 2.2 | 9.10% | 2.50% | 16.9 | -8.24% |
| Germany | 0.8 | -20.24% | -42.14% | 8.2 | -35.71% |
| Taiwan China | 0.6 | 1.71% | -7.34% | 4.3 | -32.81% |
| Finland | 0.2 | -11.11% | 48.95% | 1.4 | -11.12% |
| Others | 0.2 | -40.25% | -44.74% | 2.5 | -65.89% |
| Total | 6.8 | 2.71% | -6.76% | 55.1 | -27.82% |
| Data Source: GACC, Mysteel | |||||
2.2 Top ten countries/regions for exports
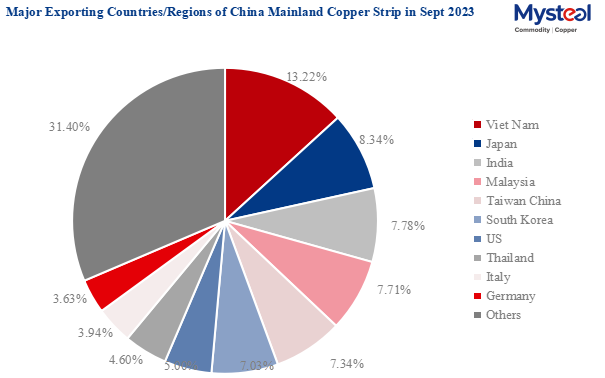
China mainland's exports of copper plate/strip were relatively balanced and scattered. The top ten countries/regions whose imports from China mainland in September increased by 3.58% year on year to 5,796 tonnes, accounting for 68.60% of China mainland's total copper plate/strip exports, were Vietnam, Japan, India, Malaysia, Taiwan China, South Korea, US, Thailand, Italy, and Germany.
Data Source: GACC, Mysteel
| Major Exporting Countries/Regions of China Mainland Copper Strip in Sept 2023 | |||||
| Countries/Regions | Export in Sept 2023 (kt) | MoM | YoY | Export in Jan-Sept 2023 (kt) | YoY |
| Viet Nam | 1.1 | 0.76% | 55.16% | 9.1 | 13.16% |
| Japan | 0.7 | 15.92% | -27.93% | 6.9 | -22.40% |
| India | 0.7 | 27.04% | 24.92% | 5.6 | 39.34% |
| Malaysia | 0.7 | 12.38% | 26.53% | 4.2 | -2.87% |
| Taiwan China | 0.6 | -9.95% | 8.61% | 4.1 | -21.10% |
| South Korea | 0.6 | -36.91% | -54.98% | 9.5 | -13.31% |
| US | 0.4 | 11.34% | 33.23% | 2.1 | -50.49% |
| Thailand | 0.4 | -15.72% | 5.08% | 3.7 | -4.47% |
| Italy | 0.3 | 26.50% | 1294.50% | 2.8 | 1439.15% |
| Germany | 0.3 | -1.56% | 20.22% | 3.3 | -42.24% |
| Others | 2.7 | -8.41% | 20.72% | 26.3 | 17.74% |
| Total | 8.5 | -3.51% | 8.41% | 77.6 | -0.13% |
| Data Source: GACC, Mysteel | |||||
Written by Edenlis Huang, huangting@mysteel.com
Edited by Paula Xu, xuzhongping@mysteel.com