China's Dec copper foil imports decrease by 9.25% YoY while increase by 3.92% MoM to 6,926t
China's refined copper foil (without backing, thickness ≤ 0.15 mm) imports decreased by 706 tonnes or 9.25% year on year while increased by 261 tonnes or 3.92% month on month to 6,926 tonnes in December 2023, and the cumulative imports in 2023 decreased by 26,122 tonnes or 24.75% year on year to 79,430 tonnes, according to the General Administration of Customs of the People's Republic of China (GACC).
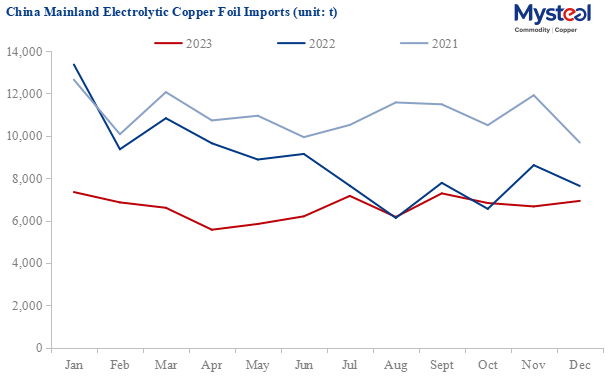
Data Source: GACC, Mysteel
Taiwan province was still the largest source region of China mainland's copper foil imports, accounting for 67.68%, with an import decrease of 3.52% month on month in December. Imports from South Korea increased by 13.17% month on month in December, accounting for 11.67% of total volume, which was China mainland's second-largest source of copper foil imports. Malaysia, Luxembourg and Japan were the third to fifth largest source regions of China's mainland copper foil imports. The average import price in December decreased by Yuan 2,654/tonne to Yuan 105,986/tonne. Among the main importing countries and regions, the average price of copper foil imported from Germany was the highest. The import price of copper foil from Taiwan China and Luxembourg was lower than the average import price.
| Sources for China's Backless Refined Copper Foil Imports | |||||
| Countries/Regions | Import in Dec 2023 (t) | Proportion | Average Import Price (Yuan/t) | MoM | YoY |
| Malaysia | 476 | 6.87% | 149,122 | 23.64% | -37.86% |
| Taiwan, China | 4,687 | 67.68% | 93,091 | -3.52% | -12.65% |
| Japan | 392 | 5.66% | 148,761 | 22.88% | 103.11% |
| South Korea | 808 | 11.67% | 115,754 | 13.17% | -11.98% |
| Germany | 18 | 0.26% | 266,399 | -60.87% | -41.94% |
| Philippines | 69 | 1.00% | 247,842 | -9.21% | 38.00% |
| Luxembourg | 469 | 6.77% | 83,063 | 81.08% | 60.07% |
| Others | 7 | 0.09% | - | - | - |
| Total | 6,926 | 100.00% | 105,986 | 3.90% | -9.25% |
| Data Source: GACC, Mysteel | |||||
China's Dec copper foil exports increase by 2.97% YoY while decrease by 0.07% MoM to 3,013t
China's refined copper foil (without backing, thickness ≤ 0.15 mm) exports increased by 87 tonnes or 2.97% year on year while decreased by 2 tonnes or 0.07% month on month to 3,013 tonnes in December 2023, and the cumulative exports in 2023 decreased by 1,676 tonnes or 4.01% year on year to 40,162 tonnes, according to the GACC.
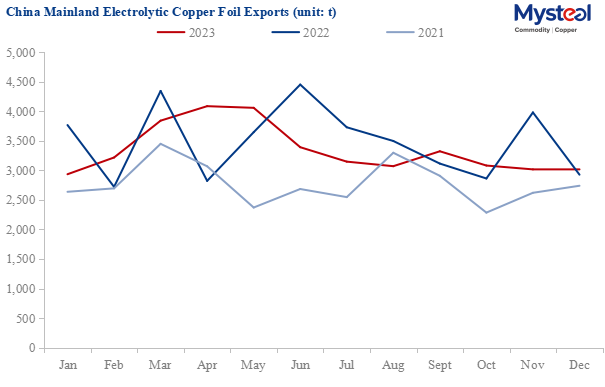
Data Source: GACC, Mysteel
There were a total of 53 destination countries and regions where China exported copper foil in December, with Malaysia, Thailand, South Korea, Egypt, and Vietnam being the top five countries, accounting for 21.87%, 18.62%, 11.25%, 10.69% and 7.14% of the cumulative export volume respectively. The average export price in December increased by Yuan 310/tonne month on month to Yuan 76,889/tonne. Among the top 10 destination countries and regions for exports, the price was lowest for exports to the UAE at Yuan 68,832/tonne, and the price was highest for exports to Hong Kong, China at Yuan 124,093/tonne.
| Destinations for China's Backless Refined Copper Foil Exports | |||||
| Countries/Regions | Export in Dec 2023 (t) | Proportion | Average Export Price (Yuan/t) | MoM | YoY |
| South Korea | 339 | 11.25% | 89,595 | 7.96% | 5.28% |
| Vietnam | 215 | 7.14% | 76,290 | 39.61% | 88.60% |
| Malaysia | 659 | 21.87% | 77,387 | 41.72% | 336.42% |
| India | 35 | 1.16% | 68,728 | 52.17% | -5.41% |
| Thailand | 561 | 18.62% | 77,756 | 19.62% | 5.85% |
| Taiwan, China | 112 | 3.72% | 92,527 | -21.68% | -41.05% |
| Indonesia | 88 | 2.92% | 66,621 | -39.73% | -17.76% |
| Saudi Arabia | 153 | 5.08% | 64,546 | -64.83% | 2.68% |
| US | 16 | 0.53% | 120,591 | 300.00% | -96.39% |
| Hongkong, China | 17 | 0.56% | 124,093 | -5.56% | -41.38% |
| Canada | 12 | 0.40% | 103,999 | 500.00% | 100.00% |
| Egypt | 322 | 10.69% | 67,425 | -9.80% | 6.27% |
| Pakistan | 167 | 5.54% | 65,321 | 20.14% | 221.15% |
| Brazil | 22 | 0.73% | 70,991 | 83.33% | 1000.00% |
| Singapore | 5 | 0.17% | 77,525 | -28.57% | -64.29% |
| UK | 12 | 0.40% | 84,607 | 200.00% | 20.00% |
| Turkey | 8 | 0.27% | 83,271 | -86.21% | -90.91% |
| Germany | 6 | 0.20% | 110,843 | -80.65% | -45.45% |
| Australia | 15 | 0.50% | 74,278 | 114.29% | 7.14% |
| UAE | 57 | 1.89% | 68,832 | 100.00% | 100.00% |
| Hungary | 19 | 0.63% | 66,597 | 100.00% | -44.12% |
| Italy | 8 | 0.27% | 96,038 | 100.00% | 166.67% |
| France | 6 | 0.20% | 86,919 | 100.00% | 200.00% |
| Poland | 56 | 1.86% | 67,304 | 5500.00% | 100.00% |
| Spain | 14 | 0.46% | 63,600 | -44.00% | 180.00% |
| Qatar | 25 | 0.83% | 63,253 | 100.00% | -24.24% |
| Columbia | 7 | 0.23% | 68,727 | 100.00% | 16.67% |
| Peru | 6 | 0.20% | 71,126 | -45.45% | 100.00% |
| Algeria | 25 | 0.83% | 63,869 | -66.67% | 100.00% |
| Argentina | 10 | 0.33% | 89,115 | 900.00% | 42.86% |
| Others | 16 | 0.52% | - | - | - |
| Total | 3,013 | 100.00% | 76,889 | -0.07% | 2.97% |
| Data Source: GACC, Mysteel | |||||
In summary, China's copper foil imports and exports remained generally stable in December. The main reason for the slight increase in imports over the previous month was that the Spring Festival holiday was approaching, so downstream customers had appropriate reserve demand. However, considering the consumption expectations for 2024, the enthusiasm for stocking up in the market was relatively weak. For the same reason, domestic processing enterprises mainly consumed finished product inventory in December, with a severe contraction in operating rates, leading to a continued downturn in exports. However, according to Mysteel's survey, China's copper foil imports and exports are expected to rebound moderately in January.
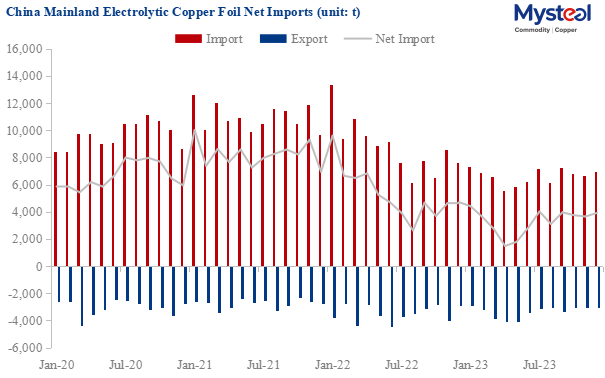
Data Source: GACC, Mysteel
Written by Edenlis Huang, huangting@mysteel.com
Edited by Paula Xu, xuzhongping@mysteel.com