| Production Data | |||||||
| Description | Production(kt) | MoM % | YoY% | YTD(kt) | YTD YoY % | Utilization Rate(%) |
Month |
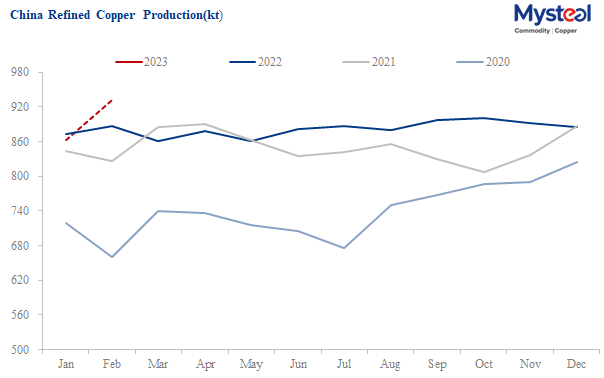
| Refined Copper | 862.5 | -2.6% | -1.1% | 862.4 | -1.1% | 75.6 | Jan-23 |
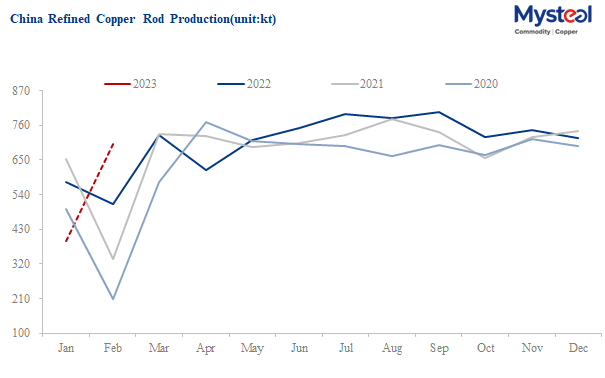
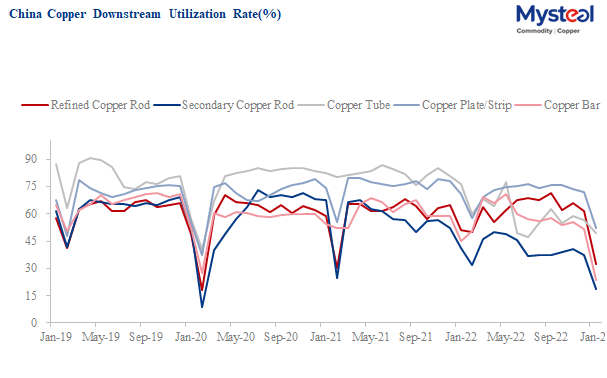
| Refined Copper Rod | 391.5 | -45.5% | -32.6% | 391.5 | -32.6% | 32.6 | Jan-23 |
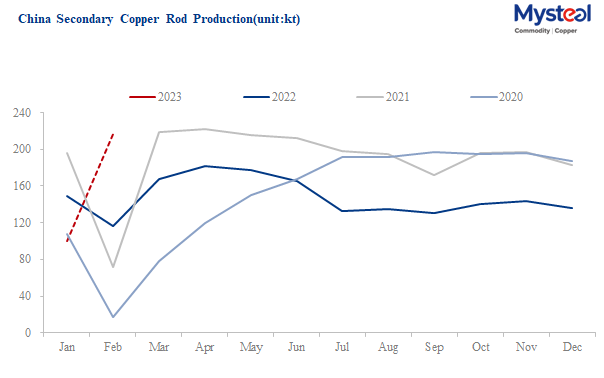
| Secondary Copper Rod | 100.6 | -25.8% | -32.7% | 100.6 | -32.7% | 18.8 | Jan-23 |
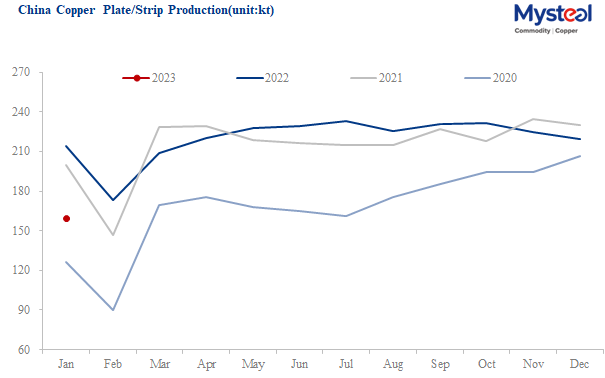
| Copper Plate/Strip | 158.9 | -27.4% | -25.7% | 159.0 | -25.7% | 52.0 | Jan-23 |
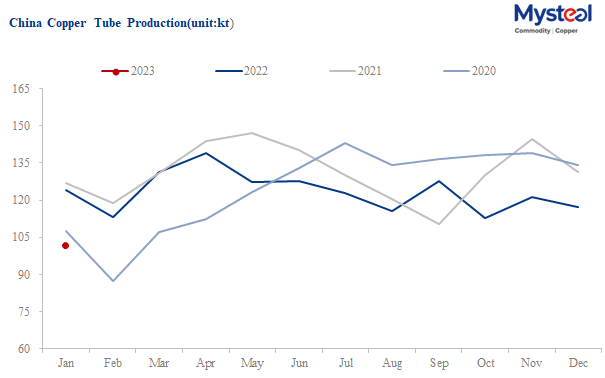
| Copper Tube/Pipe | 101.7 | -13.2% | -18.0% | 101.7 | -18.0% | 49.3 | Jan-23 |
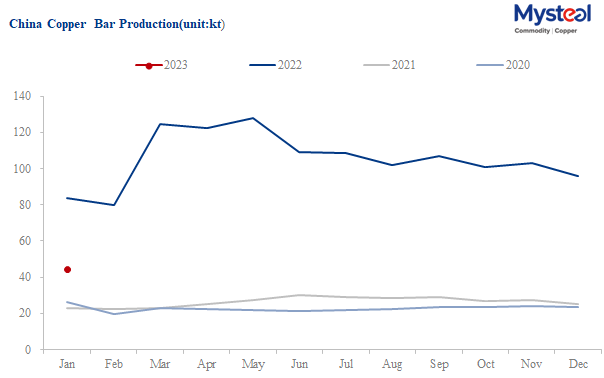
| Copper Bar | 44.4 | -53.8% | -47.1% | 44.4 | -47.1% | 23.8 | Jan-23 |
| Data Source: Mysteel | |||||||
Data Sourece: Mysteel
Data Sourece: Mysteel
Data Sourece: Mysteel
Data Sourece: Mysteel
Data Sourece: Mysteel
Data Sourece: Mysteel
Data Sourece: Mysteel
Please contact Paula Xu at xuzhongping@mysteel.com for more details and historical data.